
-
Mail us:
editor@raftpubs.org
Indexing & Abstracting
Full Text
Review ArticleDOI Number : 10.36811/jca.2021.110008Article Views : 51Article Downloads : 23
Assessment of oil recovery enhancement through surfactant flooding; Experimental and feasibility studies
Gameil Sameh1, Mohamed Ismaiel1, Ahmed Fakhry1, Omar Hesham1, Felopateer Magdy1, and A.N. El-hoshoudy 1,2*
1Petroleum Engineering department, British University in Egypt (BUE) El-shorouk city, Cairo, Egypt
2PVT-lab, Production Department, Egyptian Petroleum Research Institute, Nasr City, PO Box 11727, Cairo, Egypt
*Corresponding Author: Abdelaziz Nasr El-hoshoudy, Petroleum Engineering department, British University in Egypt (BUE) El-shorouk city, Cairo, Egypt, Email: azizchemist@yahoo.com
Article Information
Aritcle Type: Review Article
Citation: Gameil Sameh, Mohamed Ismaiel, Ahmed Fakhry, et al. 2021. Assessment of oil recovery enhancement through; Experimental and feasibility studies. J Chem Appl. 3: 01-32.
Copyright: This is an open-access article distributed under the terms of the Creative Commons Attribution License, which permits unrestricted use, distribution, and reproduction in any medium, provided the original author and source are credited. Copyright © 2021; Gameil Sameh
Publication history:
Received date: 18 February, 2021Accepted date: 08 March, 2021
Published date: 10 March, 2021
Abstract
Chemical flooding is one of the major enhanced oil recovery (EOR) techniques particularly for reservoirs where thermal methods are not applicable, that chemical flooding may be polymer flooding, alkaline flooding, surfactant flooding, or a combination of them. The application of designing a chemical flooding program is strongly affected by the current economics, reservoir oil type, and crude oil price. In this project, mechanisms of different chemical methods will be discussed, and design chemical flooding program by using a laboratory scale and programming method. This project is mainly about making a design of surfactant flooding program, through choosing the optimum surfactant concentration. Also, economic study is very important in designing the program to know if the project is profitable or not to identify its efficiency, and choosing the better type of surfactant flooding in the reservoir. The results of this project proved that the surfactant has good effect on rock wettability to more water- wet, so increase the hydrocarbon recovery.
Keywords: Surfactant flooding; Enhanced Oil Recovery; Economic profit
Introduction
Producing hydrocarbons conventionally from the reservoir passed by three stages, the first stage is producing hydrocarbon depending on natural forces that exist in the reservoir which is called the primary stage, these forces in oil reservoir maybe drive force occurred because of the existence of water aquifer, gas cap, or combination of these two fluids or the depletion occurs as a result of solution gas drive reservoir and before the pressure reaches the abandonment pressure that there is a low recovery by natural force then the company needs to go into the second stage which is a secondary recovery which depends on inject fluids that naturally exists in the reservoir to increase recovery factor than the third stage when the second stage reaches its limit which is enhanced oil recovery stage, also for the gas reservoir but in the gas, the reservoir may be by water aquifer or pressure depletion only [1].
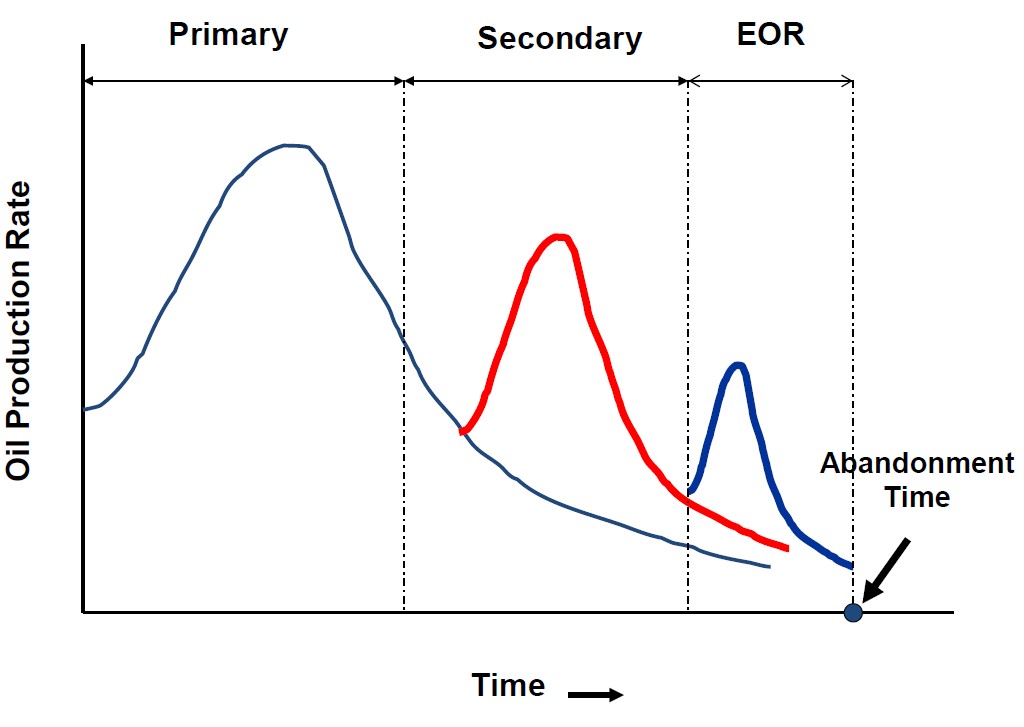
Figure 1: Oil reservoir recovery drive mechanism stages [2].
This design project mainly aims to design a program to enhance hydrocarbon recovery by chemicals, that enhanced hydrocarbon recovery is a very important process to increase hydrocarbon recovery by injecting a new fluid in the reservoir, this fluid may change rock properties like increasing porosity or permeability by making hydraulic fractures such as thermochemical fluids injection or changing rock wettability by using alkaline, or change fluid properties such as fluid viscosity, so design suitable enhanced hydrocarbon recovery is very important to increase recovery factor by knowing the needed demands for the reservoir and lowering the cost [3].
Literature review
Enhanced oil recovery methods EOR
Enhanced oil recovery (EOR) methods are used to increase the oil recovery in an economic way that is used to produce the remaining quantities of oil after using primary and secondary methods which represent 2/3 of the original quantity of oil in place.[4]. The design of an enhanced oil recovery project is very important to increase the oil recovery factor to increase the profitability so, to measure EOR project profitability, the incremental oil amount must be determined which is the difference between the amount of oil produced by using EOR and without using it as which will be illustrated by figure 2 [2].
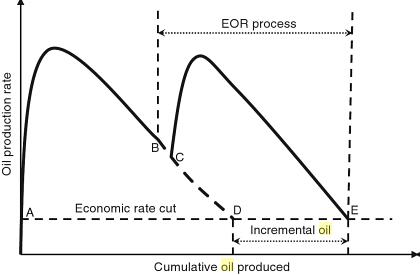
Figure 2: Incremental oil amount [2].
EOR is an alternative method to increase oil recovery that is better than making new because it may be more expensive, but these methods must not be used in reservoir life early stage because the data lack so, overall economics and timing are important factors for design EOR project [5]. EOR is classified these are: thermal methods, microbial methods, miscible EOR methods, and chemical methods.
Thermal method
This technique of EOR depends on the heat effect on crude oil which is when the temperature increases the oil viscosity decreases and oil becomes mobile, and surface tension of oil decreased, and the permeability of rock to oil increases [6]. The thermal methods used in highly viscous oil fields including steam flooding, combustion, and steam injection by the cyclic method [7].
Microbial EOR methods
This technique depends on the use of micro-organisms that form biosurfactants or produce CO2 and damage the large molecules of hydrocarbon to increase the recovery of oil, that this method has many ways to perform it as mixing the hydrate of carbon with bacteria to inject it into the reservoir and it could form surfactant, polymer, etc to increase the recovery but this method is expensive so it does not be used `widely [8].
Miscible EOR methods (CO2/ N2 injection)
The miscible EOR method means injecting gas into the reservoir especially CO2 or N2, that increases the recovery of the hydrocarbon by dissolving it in swelling and reduce oil viscosity and surface tension with reservoir rock, that this method is an economical method because the injected gas will be produced and could be used again [9].
Chemical EOR Methods
Chemical enhanced oil recovery method is an efficient technique to increase the recovery of oil, because of this method efficiency and cost this method becomes popular from the year 1980 up till now, that this technique increases the oil recovery by increasing water injected to displace oil into reservoir efficiency d by lowering the interfacial tension to displace oil and extract it from small pores and control water mobility by increasing its viscosity then sweep efficiency that reduces the amount of water produced and increase the produced oil amount [10]. The chemicals that be used in this technique may be a surfactant, polymer, alkaline, any combination of two of them, or the combination of all of them. To obtain effective chemical flooding program reservoir properties such as permeability, and temperature must be studied. [11].
Polymer flooding
This method depends on injecting polymer dissolved in water to increase water viscosity that increases the sweep efficiency by improving mobility which decreasing the fingering phenomenon that reduces the water production. Also, it affects the frictional flow that is the mobility ratio function [11]. El-hoshoudy et al [12-42] reported several publications about the use of polymer flooding in the enhanced oil recovery (EOR). The main polymer flooding function is controlling the water mobility by increasing its viscosity and decreasing the mobility to reach a better mobility ratio which is less than 1 to prevent the fingering phenomenon, and that permits the oil to be faster inflow [43]. Water with dissolved polymer affects fractional flow which is the fraction of flow rate of water to the rate of total flow which is mobility ratio function as when the mobility ratio reduces the flow rate of water decreases, as result of that the amount of produced oil increases while the decrease of residual oil as a result of increasing sweep efficiency as will be shown in the next figure [44].
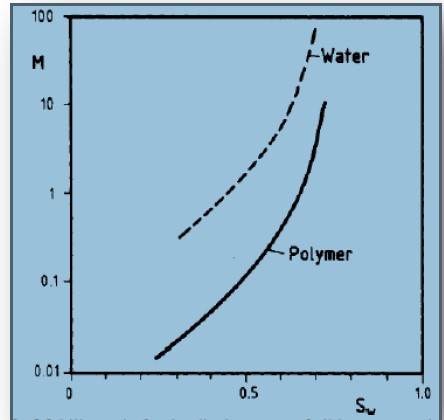
Figure 3: Polymer flooding effect on mobility ratio.
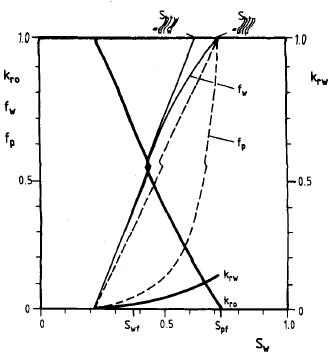
Figure 4: Polymer flooding effect on the fractional flow [44].
Alkaline Flooding
In 1917, a scientist called “Squires F “discovered that when adding an alkaline chemical during the flooding of water, leads to an increase in the efficiency of oil displacement. Alkaline flooding is one of the Enhance oil recovery methods (EOR). the process includes injecting chemicals with a high PH number to the reservoir to increase the recovery of oil. This method has been discovered in the 20th century. The alkaline flooding process starts by injecting chemicals with high ph numbers like NaOH or Na2CO3 to the reservoir while the operation of water or polymer flooding. This chemical can make a reaction with different types of oil to make surfactants. Surfactants are used to reduce the interfacial tension between water and oil and this results in increased recovery of oil. [45]. Alkaline flooding is most used in sandstone reservoirs but, it does not be used in the carbonate reservoir because the carbonate heterogeneity is very high and because of cautions which makes the problem of scaling when reacting with alkaline.
Mechanisms of Alkaline flooding
? Emulsification and entrapment
? Emulsification and entrainment
? Wettability reversal
? Oil phase swelling to reduce interfacial tension
Emulsification and entrainment
In 1942, “Subkow” observed this mechanism and take a patent for the production of oil. in 1966 which suggests a mechanism for cracking tar sands and after this injection of alkaline chemicals. When adding an alkaline chemical to a reservoir. This chemical will react with crude oil which contains naphthenic acids and this reaction from surfactants (Emulsifier). Emulsification results from the small IFT between oil and water. this makes a reaction and forms emulsions [46].
Emulsification and entrapment
This mechanism is observed in 1974 which indicates that the pore throat will be plugged by emulsions. This will make high permeability and helping in controlling mobility between fluids and increases volumetric sweep efficiency, and the PH values with variation in alkaline concentration in figure 1. From this chart, the strongest alkaline is Sodium hydroxide (NaOH) and the weakest alkaline is Sodium carbonate (Na2CO3) [45].
|
Sodium hydroxide |
NaOH |
|
Sodium carbonate |
Na2CO3 |
|
Sodium metasilicate |
Na2SiO3 |
|
Ammonia |
NH3 |
|
Sodium orthosilicate |
NaSiO4 |
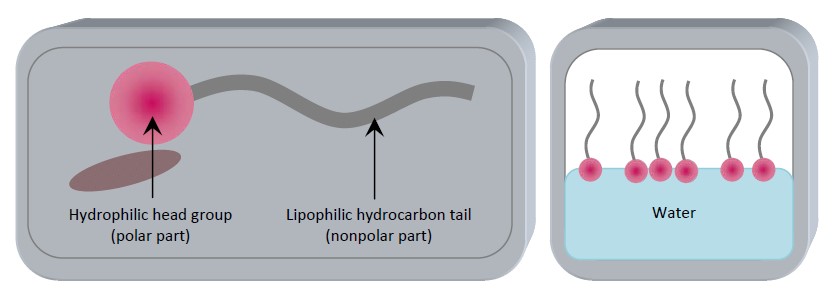
Figure 5: Surfactant structural form.
In this figure surfactant component and movement in the water. ‘Surfactants are also referred to as amphiphile molecules because they contain a nonpolar ‘tail’ and a polar ‘head’-group within the same molecule. Due to the balance that surfactant has between its components of the hydrophilic and hydrophobic part which give the surfactant, it’s the active agent. In EOR our topic the surfactant flooding the hydrophobic tail interacts with residual oil and the other part of the hydrophilic head interacts with the water as shown also in the last figure. Typically contribute to a highly significant reduction in interfacial forces between (water and oil) and (oil and rock).
The classification of surfactant.
This material can be classified on its ionic base of each group as follows.
|
Anionic |
|
|
Sodium dodecyl sulfate (SDS) |
CH3 (CH2)11SO4-Na+ |
|
Sodium dodecyl benzene sulfonate |
CH3 (CH2)11 C6H4SO3-Na+ |
|
Cationic |
|
|
Cetyltrimethylammonium bromide (CTAB) |
CH3 (CH2)15 N(CH3)3+ Br- |
|
Dodecylamine hydrochloride |
CH3 (CH2)11 NH3+ Cl- |
|
Non-ionic |
|
|
Polyethylene oxides |
CH3 (CH2)7 (O. CH2CH2)8 OH3 |
The Anionic type of surfactant is negatively charged and is commonly for industrial usage like detergents. The Cationic type is the one that has a positively charged head and this type of surfactant dissociate in water to form amphiphilic cations and anions. The nonionic surfactant is the type that has no charge and mainly is used in EOR as a co-surfactant to enhance the surfactant process. The most commonly used surfactant in EOR can be sulfonated hydrocarbons like alcohol prepopulate sulfate. That is used to achieve the maximum surfactant flooding for any oil reservoir to enhance the oil recovery after the end of natural recovery and the end of secondary recovery the EOR which surfactant flooding one of its branches. The idea for using surfactant flooding in EOR is based on the ability of surfactant to lower the surface energy which was described by the Gibbs adsorption isotherm equation:
Surfactant Flooding
This method is about the use of surfactant in EOR in the oil reservoir to ensure to have the maximum production efficiency, surfactant flooding is the injection of one or multi liquid chemicals with surfactant. This injection is effective will control the phase behavior in the oil reservoir. So, it will have the ability to mobilize the trapped crude oil by changing its IFT.
Figure 6: Surfactant effect on IFT [49].
For this principle of flooding where residual oil is to be trapped in the reservoir the movement of that oil through the narrow pores will need a very low oil/water IFT and that what surfactant flooding is used for as EOR in the oil reservoir. There can be a great potential in using a chemical process with surfactant flooding since there are the ability to design a process of oil production and an overall displacement efficiency of oil nowadays thus the reservoir under the operation of water flooding has a production rate of 50-70% of its original oil in place, in this case, it is more than useful to have surfactant flooding process to increase the production rate and thus increase the economic productivity [49].
Methodology
1. Identify the chemical type that is used in the program is in this project is a surfactant
2. Make experimental work to know the flow rate of each surfactant used
3. Make design by using MATLAB to study the efficiency of each surfactant used
4. Make a comparative study between each surfactant by knowing their efficiency and cost to know which surfactant gives better economic results.
The used surfactants including Dodecylbenzene sulfonic
This acid that is called dodecyl benzene sulfonic is considered as one of the acid classes that is called Benzenesulfonic that the position of the hydrogen is at 2 of the rings of the phenyl and this molecule of the hydrogen taking the group of the dodecyl place. And this acid that is called dodecyl benzene sulfonic is used in the operations of making detergents, this is used as an anionic surfactant. The structural formula of this acid that is called dodecyl benzene sulfonic is:
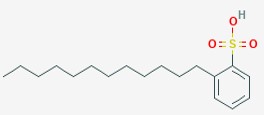
Figure 7: Structure of dodecylbenzene sulfonic surfactant.
Cetyl trimethyl ammonium bromide
Salt surfactant is considered as a cationic surfactant, the other names of this surfactant are cetrimonium bromide, trimethyl ammonium bromide, Hexadecyl trimethyl ammonium bromide, suitable for the EOR process in carbonate rock of the reservoir [50].
Experimental work
This part of the project will show the steps of work that was made in the BUE laboratory that made into steps
1. Choose five cores then measure the size of used cores
2. Measure the mass of dry cores then saturate it with water to be fully saturated then measures the mass of the core after saturation
3. Inject water into cores by flooding device to know the flow rate and measure the difference in pressure
4. Initiate cores by flooding oil into cores to make the reservoir
5. Inject brine solution into each core then measure pressure and calculate the flow rate of oil and water with a concentration of 3.5 gm of NaCl to 100 ml of water
6. Then make a surfactant solution by concentration 10000 ppm and 20000 ppm of each surfactant used and 10000ppm of the mixture of two surfactants.
7. Inject the surfactant solution by flooding the device to cores and calculate the flow rate of oil and water
Choose five cores then measure the size of used cores
In this stage choose 5 suitable cores to use in flooding by each surfactant with different concentrations and use Vernier calliper to measure each core length and diameter. Then calculate the bulk volume of each core by using cylinder volume equation V=πr2h.
Measure the mass of dry cores then saturates it with water to be fully saturated then measures the mass of the core after saturation
Use the digital mass balance to measure the mass of dry core the saturate the cores with water to be fully saturated with water then measure the core weight after the saturation. The difference between saturated core mass and dry core mass = the pore volume of the core, the divide pore volume to bulk volume to calculate the porosity of each core.
Inject water into cores
Using flooding device to inject water into each core to calculate the flow rate when the core is fully saturated by only water by calculating the produced volume of water at a specified time and calculate the change in pressure delta p to calculate the absolute permeability by using Darcy equation q=1.127kA Delta p/μL
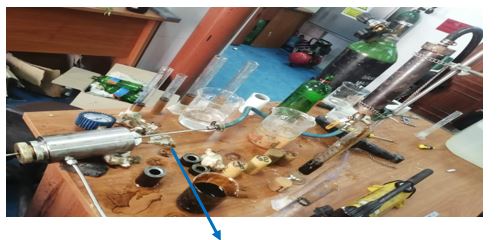
Figure 8: Flooding device.
Initiate cores by flooding oil into cores to make reservoir
Initiate cores to form the reservoir, which occurs by using a flooding device to inject oil into cores and calculate the volume of water produced until there is no amount of water could be produced then calculate the connate water volume by minus the amount of water produced from pore volume (volume of water when the core is fully saturated with water), then calculate connate water saturation Swc which equals to connate water volume divided by pore volume and calculate initial oil saturation Soi which equals to 1-Swc.
Inject brine solution into each core
Inject brine solution by specified injected volume which equals to 0.5 PV, 1pv, 1.5pb, 2pv, then measure the volume of water and oil produced to reach the injected volume of brine solution, the needed time to reach the above volumes, and delta P to calculate flow rate= volume (V)/ time (T) then effective permeability of rock to water and oil then relative permeability and saturation of oil and water in the core. The saturation of oil is calculated by minus the volume produced at each value of injection from initial oil volume then divide the result by pore volume, then calculate the saturation of water which equals oil saturation.
Make surfactant solution by different concentration each surfactant used and mixed between the two surfactants
make a solution of surfactant in water by each surfactant used by the first 10000ppm of dodecylbenzene sulphonic, crystal tram side ammonium bromide, or a mixture between them in water, then second 20000 ppm of dodecylbenzene sulphonic or Cetyl tramoside ammonium bromide.
Inject the surfactant solution into cores
Inject surfactant solution by specified injected volume which equals to 0.5 PV, 1pv, 1.5pb, 2pv, then measure the volume of water and oil produced to reach the injected volume of brine solution, the needed time to reach the above volumes, and delta P to calculate flow rate= volume (V)/ time (T) then effective permeability of rock to water and oil then relative permeability and saturation of oil and water in the core. The saturation of oil is calculated by minus the volume produced at each value of injection from initial oil volume then divide the result by pore volume, then calculate the saturation of water which equals oil saturation.
Make design by using MATLAB to study the efficiency of each surfactant used
Using the MATLAB program to make a study by using data to show the cumulative production by using surfactant according to graphs to know the efficiency of the design project.
Make a comparative study between each surfactant by knowing their efficiency and cost to know which surfactant gives better economic results
In this part of the project calculate the cost of used surfactant and compare it and the profit of cumulative oil produced to make an economic study and know if the project is efficient or not.
Core data
|
Table 3: The physical properties of the five cores data. |
|||||
|
Core number |
1 |
2 |
3 |
4 |
5 |
|
Diameter D (cm) |
3.6 |
3.7 |
3.65 |
3.65 |
3.65 |
|
Height h (cm) |
4.6 |
3.52 |
3.5 |
3.7 |
5.37 |
|
BV (cm3) |
46.84114286 |
37.86263 |
36.63688 |
38.73041 |
56.21143 |
|
dry core mass (gm) |
67.686 |
59.053 |
59.632 |
59.755 |
93.145 |
|
saturated core with water mass (gm) |
90.465 |
76.816 |
76.099 |
76.484 |
115.967 |
|
Pore volume PV (CC) |
22.779 |
17.763 |
16.467 |
16.729 |
22.822 |
|
Porosity |
0.48630325 |
0.469143 |
0.449465 |
0.431934 |
0.406003 |
|
Delta P |
5 |
0.5 |
2.5 |
5 |
12 |
|
30 |
30 |
25 |
40 |
5 |
|
|
Time |
30.48 |
30 |
23 |
30 |
60 |
|
q =v/t |
0.984251969 |
1 |
1.086957 |
1.333333 |
0.083333 |
|
oil initial volume cm3 |
14 |
10 |
9 |
9 |
14 |
|
connate water volume |
8.779 |
7.763 |
7.467 |
7.729 |
8.822 |
|
connate water saturation |
38.53988323 |
43.7032 |
45.34524 |
46.20121 |
38.65568 |
|
viscosity of water cp |
1 |
1 |
1 |
1 |
1 |
|
to calculate absolute permeability |
|||||
|
q in bbl/day |
0.531496063 |
0.54 |
0.586957 |
0.72 |
0.045 |
|
water viscosity |
1 |
1 |
1 |
1 |
1 |
|
core length in ft |
1.5091864 |
1.154856 |
1.148294 |
1.213911 |
1.761811 |
|
core diameter in ft |
1.1811024 |
1.213911 |
1.197507 |
1.197507 |
1.197507 |
|
core area in ft^2 |
1.096073691 |
1.157812 |
1.126732 |
1.126732 |
1.126732 |
|
Delta p in psia |
5 |
0.5 |
2.5 |
5 |
12 |
|
Absolute permeability in md |
129.8701257 |
955.8491 |
212.312 |
137.6591 |
5.202909 |
Flooding data
For core 1
Used surfactant: Cetyl trimethyl ammonium bromide
Concentration: 20000 ppm
Brine solution flooding:
|
Table 4: core 1 brine flooding data |
|||||||
|
Brine solution core 1 |
injected PV |
Vol. of oil cc |
vw cc |
pore volume |
vo in the reservoir |
vw in the reservoir |
|
|
|
before flooding |
|
|
22.779 |
14 |
8.779 |
|
|
Concentration |
11.3895 |
5 |
6.3895 |
22.779 |
9 |
13.779 |
|
|
35000 ppm |
22.779 |
2.5 |
20.279 |
22.779 |
6.5 |
16.279 |
|
|
|
34.1685 |
1.5 |
32.6685 |
22.779 |
5 |
17.779 |
|
|
|
45.558 |
1 |
44.558 |
22.779 |
4 |
18.779 |
|
|
|
56.9475 |
0.5 |
56.4475 |
22.779 |
3.5 |
19.279 |
|
|
Delta P |
time sec |
qo in bbl/day |
qw in bbl/day |
core length ft |
core area ft^2 |
oil viscosity |
|
|
|
|
|
|
|
|
|
|
|
12.5 |
24.34 |
0.110928513 |
0.141755546 |
1.5091864 |
1.096073691 |
3 |
|
|
12.5 |
58.06 |
0.023251808 |
0.18860937 |
1.5091864 |
1.096073691 |
3 |
|
|
12.5 |
77.86 |
0.010403288 |
0.226573208 |
1.5091864 |
1.096073691 |
3 |
|
|
12.5 |
86.47 |
0.00624494 |
0.278262056 |
1.5091864 |
1.096073691 |
3 |
|
|
12.5 |
115.31 |
0.002341514 |
0.264345243 |
1.5091864 |
1.096073691 |
3 |
|
|
water viscosity |
Ko |
Kw |
K |
|
|||
|
|
|
|
|
|
|||
|
1 |
32.52622 |
13.85509 |
129.8701 |
|
|||
|
1 |
6.817846 |
18.43455 |
129.8701 |
|
|||
|
1 |
3.05043 |
22.14511 |
129.8701 |
|
|||
|
1 |
1.831128 |
27.19714 |
129.8701 |
|
|||
|
1 |
0.686574 |
25.83692 |
129.8701 |
|
|||
|
Kro |
Krw |
So |
Sw |
RF |
cumulative oil produced |
||
|
|
|
0.614601 |
0.385399 |
|
|
||
|
0.250452 |
0.106684 |
0.395101 |
0.604899 |
0.357143 |
5 |
||
|
0.052497 |
0.141946 |
0.285351 |
0.714649 |
0.178571 |
7.5 |
||
|
0.023488 |
0.170517 |
0.2195 |
0.7805 |
0.107143 |
9 |
||
|
0.0141 |
0.209418 |
0.1756 |
0.8244 |
0.071429 |
10 |
||
|
0.005287 |
0.198944 |
0.15365 |
0.84635 |
0.035714 |
10.5 |
||
|
surfactant 1 liquid |
injected P. V |
v oil cc |
v of surfactant cc |
pore volume |
|
|
|
before flooding |
|
|
22.779 |
|
|
Concentration |
11.3895 |
1.5 |
9.8895 |
22.779 |
|
|
20000 ppm |
22.779 |
1 |
21.779 |
22.779 |
|
|
|
34.1685 |
0.5 |
33.6685 |
22.779 |
|
|
|
45.558 |
0 |
45.558 |
22.779 |
|
|
|
|
|
|
|
|
|
vo in the reservoir |
vw in the reservoir |
Delta P |
time sec |
qo in bbl/day |
|
|
3.5 |
19.279 |
|
|
|
|
|
2 |
20.779 |
10 |
15.5 |
0.052258065 |
|
|
1 |
21.779 |
10 |
22.82 |
0.023663453 |
|
|
0.5 |
22.279 |
10 |
36.17 |
0.00746475 |
|
|
0.5 |
22.279 |
10 |
49.22 |
0 |
|
|
|
|
|
|
|
|
|
qw in bbl/day |
core length ft |
core area ft^2 |
oil viscosity |
surfactant viscosity |
|
|
|
|
|
|
|
|
|
0.344537419 |
1.5091864 |
1.096073691 |
3 |
1.53 |
|
|
0.515366345 |
1.5091864 |
1.096073691 |
3 |
1.53 |
|
|
0.502653857 |
1.5091864 |
1.096073691 |
3 |
1.53 |
|
|
0.499823649 |
1.5091864 |
1.096073691 |
3 |
1.53 |
|
|
|
|
|
|
|
|
|
Ko |
Kws |
K |
Kro |
Krws |
|
|
|
|
|
|
|
|
|
19.15375 |
64.40314 |
129.8701 |
0.147484 |
0.495904 |
|
|
8.673185 |
96.33558 |
129.8701 |
0.066784 |
0.741784 |
|
|
2.735998 |
93.95928 |
129.8701 |
0.021067 |
0.723486 |
|
|
0 |
93.43024 |
129.8701 |
0 |
0.719413 |
|
|
|
|
|
|
|
|
|
So |
Sws |
|
|||
|
0.15365 |
0.84635 |
RF |
cumulative oil produced |
||
|
0.0878 |
0.9122 |
|
|
||
|
0.0439 |
0.9561 |
0.107143 |
12 |
||
|
0.02195 |
0.97805 |
0.071429 |
13 |
||
|
0.02195 |
0.97805 |
0.035714 |
13.5 |
||
|
|
|
0 |
13.5 |
||
For core 2
Used surfactant: Dodecylbenzene sulfonic
Concentration: 10000 ppm
Brine solution flooding
|
Table 6: Core 2brine flooding data. |
||||||
|
Brine solution core 1 |
injected P. V |
v oil cc |
vw cc |
pore volume |
||
|
|
before flooding |
|
|
22.779 |
||
|
Concentration |
11.3895 |
5 |
6.3895 |
22.779 |
||
|
35000 ppm |
22.779 |
2.5 |
20.279 |
22.779 |
||
|
|
34.1685 |
1.5 |
32.6685 |
22.779 |
||
|
|
45.558 |
1 |
44.558 |
22.779 |
||
|
|
56.9475 |
0.5 |
56.4475 |
22.779 |
||
|
vo in the reservoir |
vw in the reservoir |
Delta P |
time sec |
qo in bbl/day |
||
|
14 |
8.779 |
|
|
|
||
|
9 |
13.779 |
12.5 |
24.34 |
0.110928513 |
||
|
6.5 |
16.279 |
12.5 |
58.06 |
0.023251808 |
||
|
5 |
17.779 |
12.5 |
77.86 |
0.010403288 |
||
|
4 |
18.779 |
12.5 |
86.47 |
0.00624494 |
||
|
3.5 |
19.279 |
12.5 |
115.31 |
0.002341514 |
||
|
qw in bbl/day |
core length ft |
core area ft^2 |
oil viscosity |
water viscosity |
||
|
0.141755546 |
1.5091864 |
1.096073691 |
3 |
1 |
||
|
0.18860937 |
1.5091864 |
1.096073691 |
3 |
1 |
||
|
0.226573208 |
1.5091864 |
1.096073691 |
3 |
1 |
||
|
0.278262056 |
1.5091864 |
1.096073691 |
3 |
1 |
||
|
0.264345243 |
1.5091864 |
1.096073691 |
3 |
1 |
||
|
Ko |
Kw |
K |
Kro |
Krw |
||
|
32.52622 |
13.85509 |
129.8701 |
0.250452 |
0.106684 |
||
|
6.817846 |
18.43455 |
129.8701 |
0.052497 |
0.141946 |
||
|
3.05043 |
22.14511 |
129.8701 |
0.023488 |
0.170517 |
||
|
1.831128 |
27.19714 |
129.8701 |
0.0141 |
0.209418 |
||
|
0.686574 |
25.83692 |
129.8701 |
0.005287 |
0.198944 |
||
|
So |
Sw |
RF |
cumulative oil produced |
|||
|
0.614601 |
0.385399 |
|
|
|||
|
0.395101 |
0.604899 |
0.178571 |
2.5 |
|||
|
0.285351 |
0.714649 |
0.107143 |
4 |
|||
|
0.2195 |
0.7805 |
0.035714 |
4.5 |
|||
|
0.1756 |
0.8244 |
0.035714 |
5 |
|||
|
0.15365 |
0.84635 |
0.035714 |
5.5 |
|||
|
surfactant 1 powder |
injected P.V |
v oil cc |
v of surfactant cc |
pore volume |
||
|
|
before flooding |
|
|
22.779 |
||
|
Concentration |
11.3895 |
1.5 |
9.8895 |
22.779 |
||
|
20000 ppm |
22.779 |
1 |
21.779 |
22.779 |
||
|
|
34.1685 |
0.5 |
33.6685 |
22.779 |
||
|
|
45.558 |
0 |
45.558 |
22.779 |
||
|
vo in the reservoir |
vw in the reservoir |
Delta P |
time sec |
qo in bbl/day |
||
|
3.5 |
19.279 |
|
|
|
||
|
2 |
20.779 |
10 |
15.5 |
0.052258065 |
||
|
1 |
21.779 |
10 |
22.82 |
0.023663453 |
||
|
0.5 |
22.279 |
10 |
36.17 |
0.00746475 |
||
|
0.5 |
22.279 |
10 |
49.22 |
0 |
||
|
qw in bbl/day |
core length ft |
core area ft^2 |
oil viscosity |
surfactant viscosity |
||
|
|
|
|
|
|
||
|
0.344537419 |
1.5091864 |
1.096073691 |
3 |
1.53 |
||
|
0.515366345 |
1.5091864 |
1.096073691 |
3 |
1.53 |
||
|
0.502653857 |
1.5091864 |
1.096073691 |
3 |
1.53 |
||
|
0.499823649 |
1.5091864 |
1.096073691 |
3 |
1.53 |
||
|
Ko |
Kws |
K |
Kro |
Krws |
||
|
|
|
|
|
|
||
|
19.15375 |
64.40314 |
129.8701 |
0.147484 |
0.495904 |
||
|
8.673185 |
96.33558 |
129.8701 |
0.066784 |
0.741784 |
||
|
2.735998 |
93.95928 |
129.8701 |
0.021067 |
0.723486 |
||
|
0 |
93.43024 |
129.8701 |
0 |
0.719413 |
||
|
So |
Sws |
RF |
cumulative oil produced |
|||
|
0.15365 |
0.84635 |
|
|
|||
|
0.0878 |
0.9122 |
0.142857 |
7.5 |
|||
|
0.0439 |
0.9561 |
0.107143 |
9 |
|||
|
0.02195 |
0.97805 |
0.035714 |
9.5 |
|||
|
0.02195 |
0.97805 |
0 |
9.5 |
|||
For core 3
Used surfactant: Cetyl trimethyl ammonium bromide
Concentration: 10000 ppm
Brine solution flooding
|
Brine water core 3 |
injected P.V |
v oil cc |
vw cc |
pore volume |
||
|
|
before flooding |
|
|
16.467 |
||
|
Concentration |
8.2335 |
2 |
6.2335 |
16.467 |
||
|
35000 ppm |
16.467 |
1.5 |
14.967 |
16.467 |
||
|
|
24.7005 |
0.5 |
24.2005 |
16.467 |
||
|
|
32.934 |
0.5 |
32.434 |
16.467 |
||
|
|
41.1675 |
0.5 |
40.6675 |
16.467 |
||
|
vo in reservoir |
vw in reservoir |
Delta P |
time sec |
qo bbl/day |
||
|
9 |
7.467 |
|
|
|
||
|
7 |
9.467 |
2.5 |
27.57 |
0.03917301 |
||
|
5.5 |
10.967 |
2.5 |
87.27 |
0.00928154 |
||
|
5 |
11.467 |
2.5 |
125 |
0.00216 |
||
|
4.5 |
11.967 |
2.5 |
105 |
0.00257143 |
||
|
4 |
12.467 |
2.5 |
101 |
0.00267327 |
||
|
qw bbl/ day |
core length ft |
core area ft^2 |
oil viscosity |
water viscosity |
||
|
|
|
|
|
|
||
|
0.12209249 |
1.148294 |
1.126731616 |
3 |
1 |
||
|
0.09261121 |
1.148294 |
1.126731616 |
3 |
1 |
||
|
0.10454616 |
1.148294 |
1.126731616 |
3 |
1 |
||
|
0.16680343 |
1.148294 |
1.126731616 |
3 |
1 |
||
|
0.2174302 |
1.148294 |
1.126731616 |
3 |
1 |
||
|
Ko |
Kw |
K |
Kro |
Krw |
||
|
|
|
|
|
|
||
|
42.50861 |
44.16291 |
129.8701 |
0.327316 |
0.340054 |
||
|
10.07187 |
33.49903 |
129.8701 |
0.077553 |
0.257943 |
||
|
2.343925 |
37.8161 |
129.8701 |
0.018048 |
0.291184 |
||
|
2.790387 |
60.3356 |
129.8701 |
0.021486 |
0.464584 |
||
|
2.900897 |
78.64816 |
129.8701 |
0.022337 |
0.605591 |
||
|
So |
Sw |
RF |
cumulative oil produced |
|||
|
0.546548 |
0.453452 |
|
|
|||
|
0.425093 |
0.574907 |
0.142857 |
2 |
|||
|
0.334001 |
0.665999 |
0.107143 |
3.5 |
|||
|
0.303638 |
0.696362 |
0.035714 |
4 |
|||
|
0.273274 |
0.726726 |
0.035714 |
4.5 |
|||
|
0.24291 |
0.75709 |
0.035714 |
5 |
|||
Surfactant flooding
|
Table 9: Surfactant flooding data. |
||||||
|
surfactant 1 powder |
injected P.V |
v oil cc |
v of surfactant cc |
pore volume |
||
|
|
before flooding |
|
|
16.467 |
||
|
Concentration |
8.2335 |
1.5 |
6.7335 |
16.467 |
||
|
10000 ppm |
16.467 |
0.5 |
15.967 |
16.467 |
||
|
|
24.7005 |
0.5 |
24.2005 |
16.467 |
||
|
|
32.934 |
0.5 |
32.434 |
16.467 |
||
|
|
41.1675 |
0 |
41.1675 |
16.467 |
||
|
vo in reservoir |
vw in reservoir |
Delta P |
time sec |
qo bbl/day |
||
|
4 |
12.467 |
|
|
|
||
|
2.5 |
13.967 |
10 |
48.21 |
0.01680149 |
||
|
2 |
14.467 |
10 |
37.33 |
0.00723279 |
||
|
1.5 |
14.967 |
10 |
39 |
0.00983965 |
||
|
1 |
15.467 |
10 |
39.332 |
0.01111111 |
||
|
1 |
15.467 |
10 |
33 |
0 |
||
|
qws bbl/day |
core length ft |
core area ft^2 |
oil viscosity |
surfactant viscosity |
||
|
|
|
|
|
|
||
|
0.0754219 |
1.148294 |
1.126731616 |
3 |
2 |
||
|
0.23097187 |
1.148294 |
1.126731616 |
3 |
2 |
||
|
0.47624891 |
1.148294 |
1.126731616 |
3 |
2 |
||
|
0.72075556 |
1.148294 |
1.126731616 |
3 |
2 |
||
|
0.741015 |
1.148294 |
1.126731616 |
3 |
2 |
||
|
Ko |
Kws |
K |
Kro |
Krws |
||
|
|
|
|
|
|
||
|
4.558037 |
15.20936 |
129.8701 |
0.035097 |
0.105033 |
||
|
1.962166 |
46.57712 |
129.8701 |
0.015109 |
0.321654 |
||
|
2.669375 |
96.03898 |
129.8701 |
0.01446 |
0.4666 |
||
|
3.014307 |
145.3455 |
129.8701 |
0.014343 |
0.62 |
||
|
0 |
149.431 |
129.8701 |
0 |
0.938132 |
||
|
So |
Sw |
RF |
cumulative oil produced |
|||
|
0.24291 |
0.75709 |
|
|
|||
|
0.151819 |
0.848181 |
0.107143 |
6.5 |
|||
|
0.121455 |
0.878545 |
0.035714 |
7 |
|||
|
0.091091 |
0.908909 |
0.035714 |
7.5 |
|||
|
0.060728 |
0.939272 |
0.035714 |
8 |
|||
|
0.060728 |
0.939272 |
0 |
8 |
|||
For core 4
Used surfactant: Dodecylbenzene sulfonic: Concentration: 20000 ppm
Brine solution flooding
|
Brine solution core 4 |
injected P.V |
v oil cc |
vw cc |
pore volume |
||
|
|
before flooding |
|
|
16.729 |
||
|
Concentration |
8.3645 |
2.5 |
5.8645 |
16.729 |
||
|
35000 ppm |
16.729 |
1.5 |
15.229 |
16.729 |
||
|
|
25.0935 |
1 |
24.0935 |
16.729 |
||
|
|
33.458 |
1 |
32.458 |
16.729 |
||
|
|
41.8225 |
0.5 |
41.3225 |
16.729 |
||
|
vo in reservoir |
vw in reservoir |
Delta P |
Time |
qo in bbl/day |
||
|
9 |
7.729 |
|
|
|
||
|
6.5 |
10.229 |
12.5 |
13.76 |
0.098110465 |
||
|
5 |
11.729 |
12.5 |
27.4 |
0.029562044 |
||
|
4 |
12.729 |
12.5 |
40.5 |
0.013333333 |
||
|
3 |
13.729 |
12.5 |
56.3 |
0.009591474 |
||
|
2.5 |
14.229 |
12.5 |
79.4 |
0.003400504 |
||
|
qw in bbl/day |
core length ft |
core area ft^2 |
oil viscosity |
water viscosity |
||
|
|
|
|
|
|
||
|
0.230147529 |
1.2139108 |
1.126731616 |
3 |
1 |
||
|
0.300133577 |
1.2139108 |
1.126731616 |
3 |
1 |
||
|
0.321246667 |
1.2139108 |
1.126731616 |
3 |
1 |
||
|
0.311320071 |
1.2139108 |
1.126731616 |
3 |
1 |
||
|
0.281034635 |
1.2139108 |
1.126731616 |
3 |
1 |
||
|
Ko |
Kw |
K |
Kro |
Krw |
||
|
|
|
|
|
|
||
|
22.50966 |
17.601054 |
137.659082 |
0.163517 |
0.12786 |
||
|
6.782473 |
22.953396 |
137.659082 |
0.04927 |
0.166741 |
||
|
3.059091 |
24.568067 |
137.659082 |
0.022222 |
0.17847 |
||
|
2.200589 |
23.808909 |
137.659082 |
0.015986 |
0.172956 |
||
|
0.780184 |
21.492761 |
137.659082 |
0.005668 |
0.15613 |
||
|
So |
Sw |
RF |
cumulative oil produced |
|
||
|
0.537988 |
0.462012 |
|
|
|
||
|
0.388547 |
0.611453 |
0.178571 |
2.5 |
|
||
|
0.298882 |
0.701118 |
0.107143 |
4 |
|
||
|
0.239106 |
0.760894 |
0.071429 |
5 |
|
||
|
0.179329 |
0.820671 |
0.071429 |
6 |
|
||
|
0.149441 |
0.850559 |
0.035714 |
6.5 |
|
||
Surfactant flooding
|
|
||||||
|
surfactant 2 |
injected P.V |
v oil cc |
v of surfactant cc |
pore volume |
|
|
|
|
before flooding |
|
|
16.729 |
|
|
|
Concentration |
8.3645 |
1.5 |
6.8645 |
16.729 |
|
|
|
20000 ppm |
16.729 |
0.5 |
16.229 |
16.729 |
|
|
|
|
25.0935 |
0.25 |
24.8435 |
16.729 |
|
|
|
|
33.458 |
0 |
33.458 |
16.729 |
|
|
|
vo in reservoir |
vw in reservoir |
Delta P |
Time |
qo in bbl/day |
|
|
|
2.5 |
14.229 |
|
|
|
|
|
|
1 |
15.729 |
5 |
12 |
0.0675 |
|
|
|
0.5 |
16.229 |
5 |
22 |
0.012272727 |
|
|
|
0.25 |
16.479 |
5 |
28 |
0.004821429 |
|
|
|
0.25 |
16.479 |
5 |
41.96 |
0 |
|
|
|
qw in bbl/day |
core length ft |
core area ft^2 |
oil viscosity |
surfactant viscosity |
|
|
|
|
|
|
|
|
|
|
|
0.3089025 |
1.2139108 |
1.126731616 |
3 |
1.43 |
|
|
|
0.398348182 |
1.2139108 |
1.126731616 |
3 |
1.43 |
|
|
|
0.479124643 |
1.2139108 |
1.126731616 |
3 |
1.43 |
|
|
|
0.430584366 |
1.2139108 |
1.126731616 |
3 |
1.43 |
|
|
|
Ko |
Kws |
K |
Kro |
Krws |
|
|
|
|
|
|
|
|
|
|
|
38.71662 |
84.455869 |
137.659082 |
0.28125 |
0.613515 |
|
|
|
7.039385 |
108.91088 |
137.659082 |
0.051136 |
0.791164 |
|
|
|
2.765473 |
130.99566 |
137.659082 |
0.020089 |
0.951595 |
|
|
|
0 |
117.72445 |
137.659082 |
0 |
0.855188 |
|
|
|
So |
Sws |
RF |
cumulative oil produced |
|||
|
0.149441 |
0.850559 |
|
|
|||
|
0.059776 |
0.940224 |
0.107143 |
8 |
|||
|
0.029888 |
0.970112 |
0.035714 |
8.5 |
|||
|
0.014944 |
0.985056 |
0.017857 |
8.75 |
|||
|
0.014944 |
0.985056 |
0 |
8.75 |
|||
Core 5
The mixture of two surfactants.
Concentration= 10000ppm
Brine solution flooding
|
Brine solution core 5 |
injected P.V |
v oil produced cc |
vw produced cc |
pore volume |
||
|
|
before flooding |
0 |
0 |
22.822 |
||
|
Concentration |
11.411 |
3 |
8.411 |
22.822 |
||
|
35000 ppm |
22.822 |
2 |
20.822 |
22.822 |
||
|
|
34.233 |
1.5 |
32.733 |
22.822 |
||
|
|
45.644 |
0 |
45.644 |
22.822 |
||
|
v of water in the reservoir |
vo in the reservoir |
Delta P |
time |
qo in bbl/day |
||
|
8.822 |
14 |
|
|
|
||
|
11.822 |
11 |
40 |
76.49 |
0.021179239 |
||
|
13.822 |
9 |
40 |
119.5 |
0.009037657 |
||
|
15.322 |
7.5 |
40 |
132.96 |
0.006092058 |
||
|
15.322 |
7.5 |
40 |
227 |
0 |
||
|
qw in bbl/day |
core length ft |
core area ft^2 |
oil viscosity |
water viscosity |
||
|
|
|
|
3 |
1 |
||
|
0.059379527 |
1.76181108 |
1.126731616 |
3 |
1 |
||
|
0.094091046 |
1.76181108 |
1.126731616 |
3 |
1 |
||
|
0.132940884 |
1.76181108 |
1.126731616 |
3 |
1 |
||
|
0.108580441 |
1.76181108 |
1.126731616 |
3 |
1 |
||
|
Ko |
Kw |
K |
Kro |
Krw |
||
|
|
|
5.202909 |
0 |
0 |
||
|
2.20387296 |
2.059641721 |
5.202909 |
0.423585 |
0.39586351 |
||
|
0.94044208 |
3.2636475 |
5.202909 |
0.180753 |
0.62727364 |
||
|
0.63392841 |
4.611195259 |
5.202909 |
0.121841 |
0.88627256 |
||
|
0 |
3.766227482 |
5.202909 |
0 |
0.7238696 |
||
|
So |
Sw |
RF |
cumulative oil produced |
|||
|
0.613443 |
0.386557 |
|
|
|||
|
0.481991 |
0.518009 |
0.214286 |
3 |
|||
|
0.394356 |
0.605644 |
0.142857 |
5 |
|||
|
0.32863 |
0.67137 |
0.107143 |
6.5 |
|||
|
0.32863 |
0.67137 |
0 |
6.5 |
|||
Surfactant flooding
|
a mix between surfactant 2 and 3 |
injected PV |
v oil produced cc |
v of surfactant produced cc |
pore volume |
||
|
|
before flooding |
0 |
0 |
22.822 |
||
|
Concentration |
11.411 |
1.7 |
9.711 |
22.822 |
||
|
10000 ppm |
22.822 |
3 |
19.822 |
22.822 |
||
|
|
34.233 |
2.5 |
31.733 |
22.822 |
||
|
vw in the reservoir |
vo in the reservoir |
Delta P |
time |
qo in bbl/day |
||
|
15.322 |
7.5 |
|
|
|
||
|
17.022 |
5.8 |
45 |
150 |
0.00612 |
||
|
20.022 |
2.8 |
45 |
280 |
0.005785714 |
||
|
22.522 |
0.3 |
45 |
430 |
0.003139535 |
||
|
qw in bbl/day |
core length ft |
core area ft^2 |
oil viscosity |
surfactant viscosity |
||
|
|
|
|
3 |
2 |
||
|
0.0349596 |
1.76181108 |
1.126731616 |
3 |
2 |
||
|
0.038228143 |
1.76181108 |
1.126731616 |
3 |
2 |
||
|
0.039850744 |
1.76181108 |
1.126731616 |
3 |
2 |
||
|
Ko |
Kws |
K |
kro |
Krws |
||
|
|
|
5.202909 |
0.34 |
0 |
||
|
0.56607647 |
2.155752393 |
5.202909 |
0.1088 |
0.414336 |
||
|
0.53515633 |
2.357304158 |
5.202909 |
0.102857 |
0.45307429 |
||
|
0.29039491 |
2.457360414 |
5.202909 |
0.055814 |
0.47230512 |
||
|
So |
Sws |
RF |
cumulative oil produced |
|||
|
0.32863 |
0.67137 |
|
|
|||
|
0.254141 |
0.745859 |
0.214286 |
8.2 |
|||
|
0.122689 |
0.877311 |
0.178571 |
11.2 |
|||
|
0.013145 |
0.986855 |
0 |
13.7 |
|||
Results and Analysis
For core 1: Brine flooding
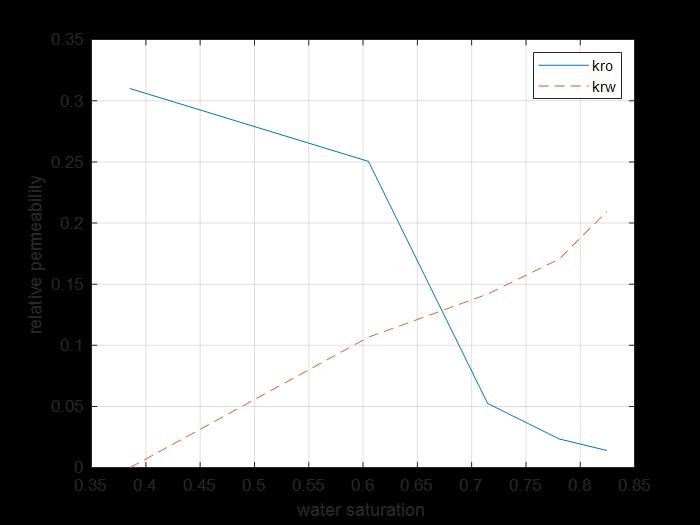
Figure 9: Relative permeability of water and oil curves for core 1.
Figure 9 shows the oil and water relative permeability versus the saturation of water, which showed that increasing the injected PV of water will increase the relative permeability of water and decrease the relative permeability of oil according to brine solution flooding to the first core, also, the water saturation increases. This is due to the high-water mobility, while there is an intersection between the two curves at 0.674 SW which refers that the rock is strongly water wet.
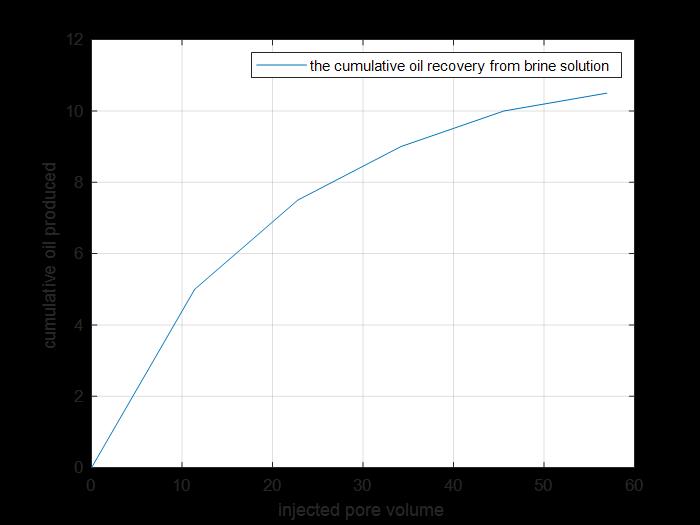
Figure 10: Cumulative oil produced by secondary and tertiary recovery.
The previous figure shows the cumulative oil produced by primary and secondary recovery methods by using brine solution injection.
Surfactant flooding
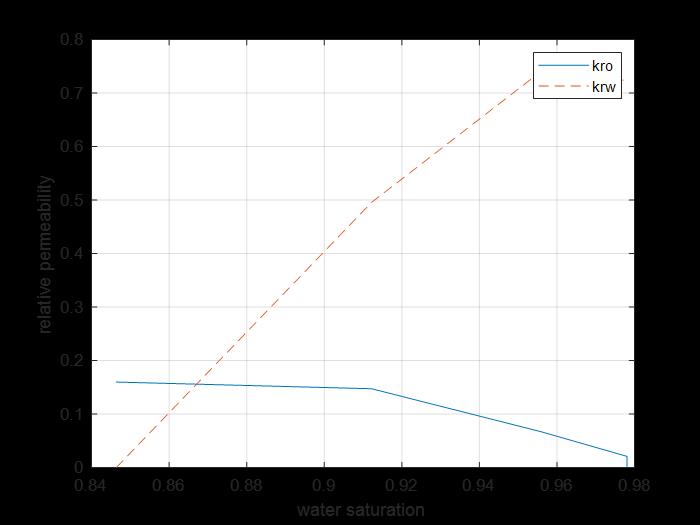
Figure 11: Relative permeability saturation curves of oil and surfactant for core 2.
The previous figure shows the oil and water relative permeability versus the saturation of water, which showed that increasing the injected PV of water will increase the relative permeability of water and decrease the relative permeability of oil according to brine solution flooding to the first core, also, the water saturation increases. This is due to the high-water mobility, while there is an intersection between the two curves at 0.862 SW which refers that the rock is strongly water-wet more than when using water flooding and that means the productivity index increased because rock wettability to oil decreased.

Figure 12: Cumulative oil produced from tertiary recovery.
The previous figure shows the cumulative oil produced by primary and secondary recovery methods by using surfactant solution injection to core 1 (cumulative production from tertiary recovery).
Core 2: Brine flooding
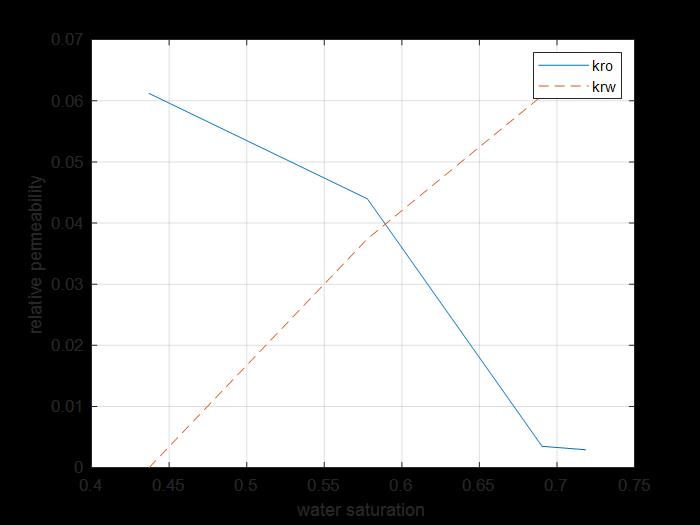
Figure 13: kr saturation curves of water and oil for core 2.
The previous figure shows the oil and water relative permeability versus the saturation of water, which showed that increasing the injected PV of water will increase the relative permeability of water and decrease the relative permeability of oil according to brine solution flooding to the first core, also, the water saturation increases. This is due to the high-water mobility, while there is an intersection between the two curves at 0.58 SW which refers that the rock is not so strong water wet.
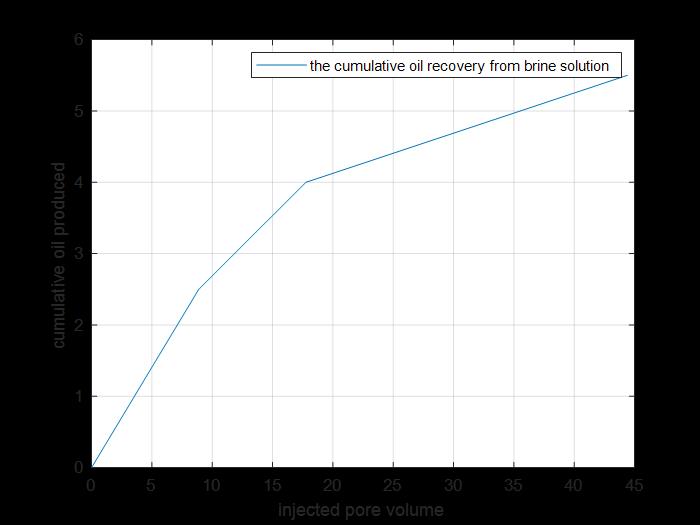
Figure 14: Cumulative oil produced from primary and secondary recovery.
The previous figure shows the cumulative oil produced by primary and secondary recovery methods by using brine solution injection for core 2.
Surfactant flooding

Figure 15: kr saturation curve of oil and surfactant for core 2.
The previous figure shows the oil and water relative permeability versus the saturation of water, which showed that increasing the injected PV of water will increase the relative permeability of water and decrease the relative permeability of oil according to brine solution flooding to the first core, also, the water saturation increases. This is due to the high-water mobility, while there is an intersection between the two curves at 0.788 SW which refers that the rock is strongly water-wet more than when using water flooding and that means the productivity index increased because rock wettability to oil decreased.
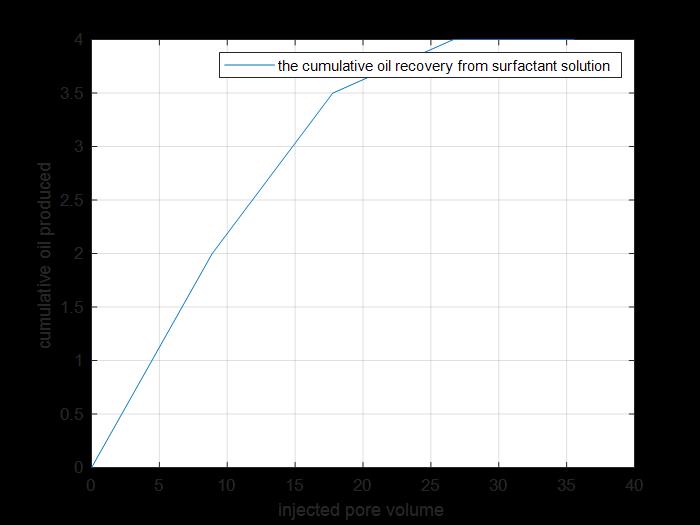
Figure 16: Cumulative oil produced by tertiary recovery.
The previous figure shows the cumulative oil produced by primary and secondary recovery methods by using surfactant solution injection to core 2 (cumulative production from tertiary recovery).
Core 3
Brine flooding
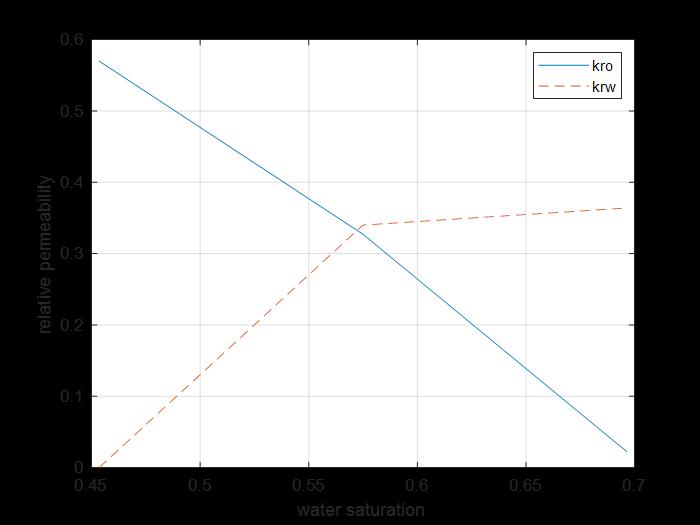
Figure 17: Core 3 kr sw curves of water and oil.
The previous figure shows the oil and water relative permeability versus the saturation of water, which showed that increasing the injected PV of water will increase the relative permeability of water and decrease the relative permeability of oil according to brine solution flooding to the first core, also, the water saturation increases. This is due to the high-water mobility, while there is an intersection between the two curves at 0.5748 SW which refers that the rock is not so strong water wet.
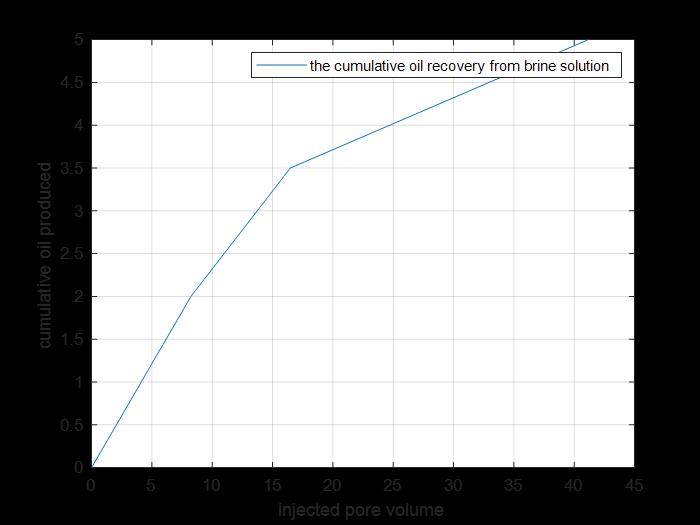
Figure 18: Cumulative oil produced by primary and secondary recovery.
The previous figure shows the cumulative oil produced by primary and secondary recovery methods by using brine solution injection for core 3.
For Surfactant flooding
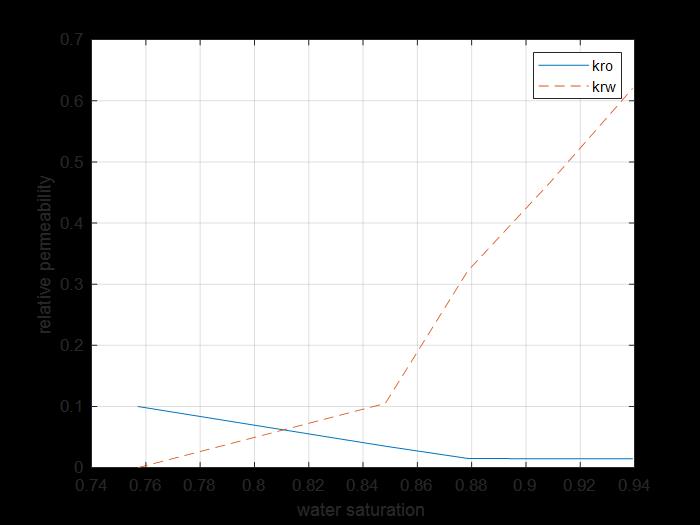
Figure 19: Core 3 krs and kro sw curves.
The previous figure shows the oil and water relative permeability versus the saturation of water, which showed that increasing the injected PV of water will increase the relative permeability of water and decrease the relative permeability of oil according to brine solution flooding to the first core, also, the water saturation increases. This is due to the high-water mobility, while there is an intersection between the two curves at 0.81 SW which refers that the rock is strongly water-wet more than when using water flooding and that means the productivity index increased because rock wettability to oil decreased.
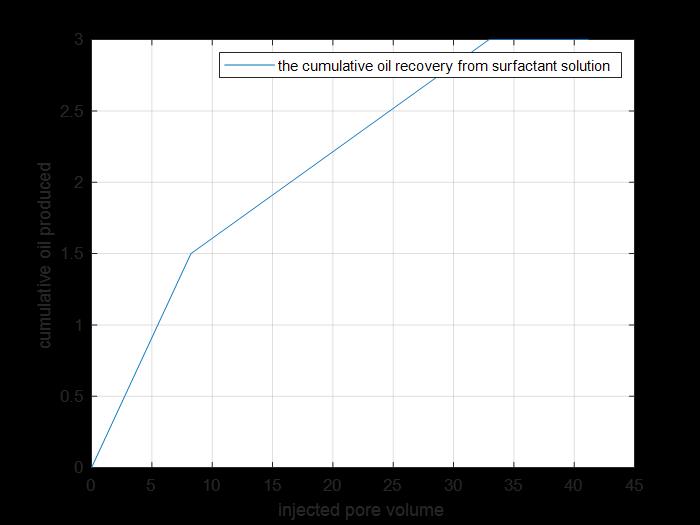
Figure 20: Cumulative oil produced by tertiary recovery.
The previous figure shows the cumulative oil produced by primary and secondary recovery methods by using surfactant solution injection to core 3(cumulative production from tertiary recovery).
Core 4
Brine solution
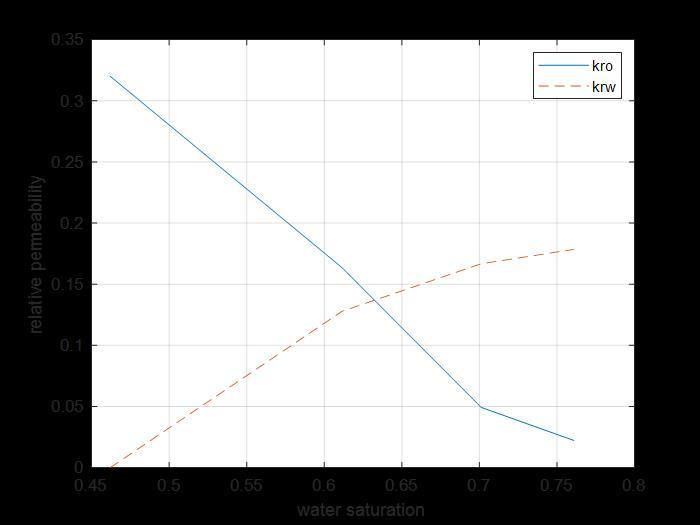
Figure 21: Krw and kro sw curves for core 4.
The previous figure shows the oil and water relative permeability versus the saturation of water, which showed that increasing the injected PV of water will increase the relative permeability of water and decrease the relative permeability of oil according to brine solution flooding to the first core, also, the water saturation increases. This is due to the high-water mobility, while there is an intersection between the two curves at 0.674 SW which refers that the rock is strongly water wet.
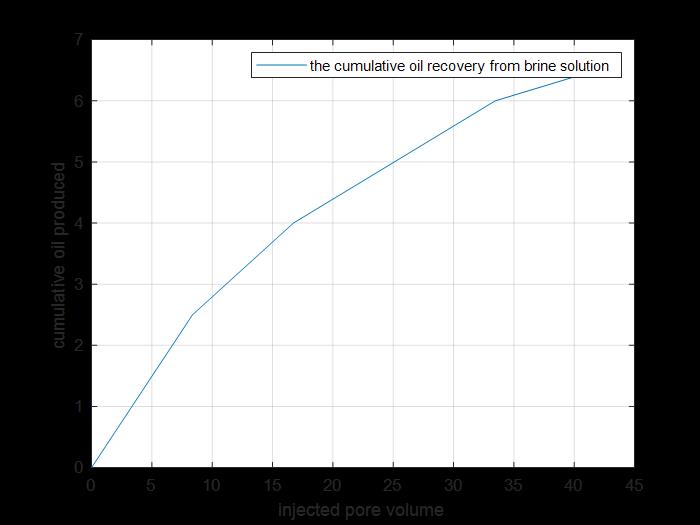
Figure 22: Primary and secondary cumulative recovery.
The previous figure shows the cumulative oil produced by primary and secondary recovery methods by using brine solution injection for core 4.
Surfactant flooding
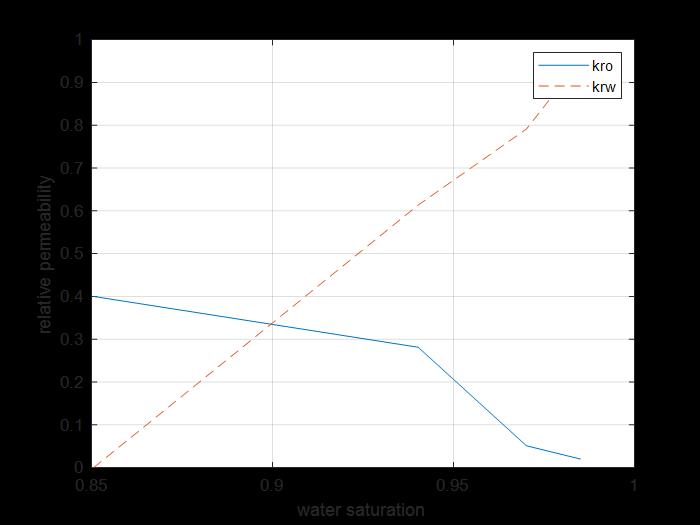
Figure 23: Krs Kro sw curves core 4.
The previous figure shows the oil and water relative permeability versus the saturation of water, which showed that increasing the injected PV of water will increase the relative permeability of water and decrease the relative permeability of oil according to brine solution flooding to the first core, also, the water saturation increases. This is due to the high-water mobility, while there is an intersection between the two curves at 0.9 SW which refers that the rock is strongly water-wet more than when using water flooding and that means the productivity index increased because rock wettability to oil decreased.
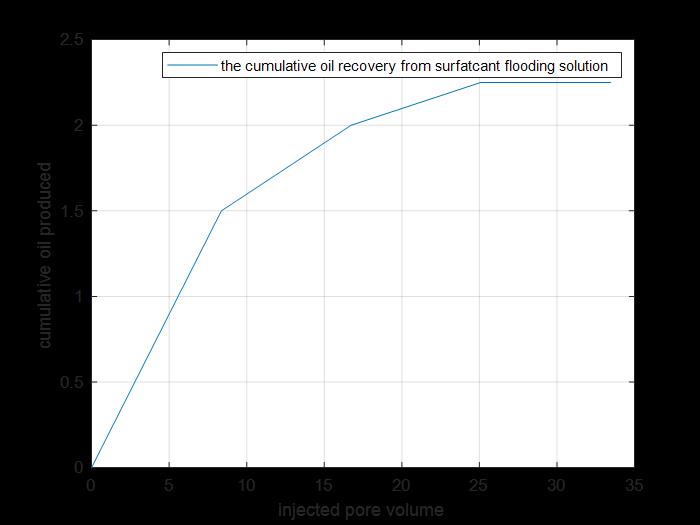
Figure 24: Tertiary cumulative recovery.
The previous figure shows the cumulative oil produced by primary and secondary recovery methods by using surfactant solution injection to core 4(cumulative production from tertiary recovery).
The previous figure shows the oil and water relative permeability versus the saturation of water, which showed that increasing the injected PV of water will increase the relative permeability of water and decrease the relative permeability of oil according to brine solution flooding to the first core, also, the water saturation increases. This is due to the high-water mobility, while there is an intersection between the two curves at 0.524 SW which refers that the rock is not so strong water wet.
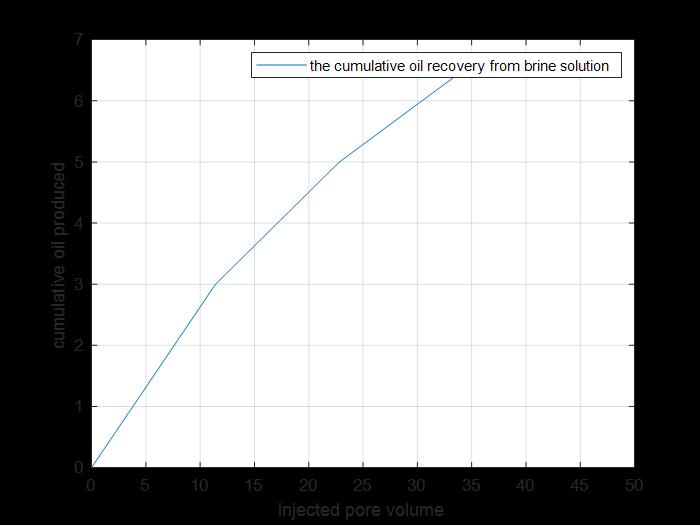
Figure 26: Primary and secondary cumulative oil produced.
The previous figure shows the cumulative oil produced by primary and secondary recovery methods by using brine solution injection for core 5.
Surfactant flooding
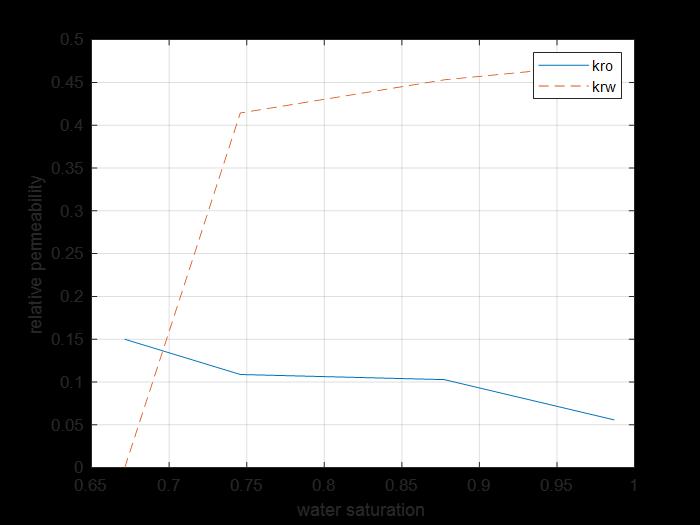
Figure 27: krs Kro saturation curves core 5.
The previous figure shows the oil and water relative permeability versus the saturation of water, which showed that increasing the injected PV of water will increase the relative permeability of water and decrease the relative permeability of oil according to brine solution flooding to the first core, also, the water saturation increases. This is due to the high-water mobility, while there is an intersection between the two curves at 0.68 SW which refers that the rock is strongly water-wet more than when using water flooding and that means the productivity index increased because rock wettability to oil decreased.
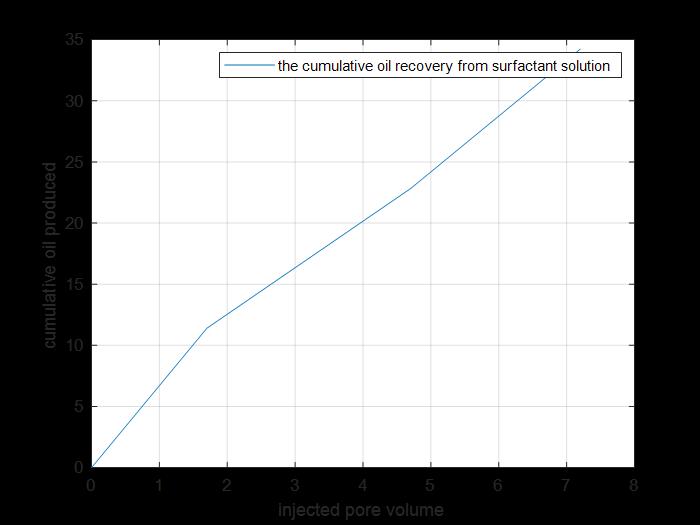
Figure 28: Tertiary cumulative oil amount produced.
The previous figure shows the cumulative oil produced by primary and secondary recovery methods by using surfactant solution injection to core 5(cumulative production from tertiary recovery).
Analysis of Results
As shown from the relative permeability curves of the 5 cores used, the 5 reservoirs are water wet that the surfactant also increases the wettability of rock to water that increases the oil recovery also as shown from cumulative oil produced curves that mean that the design is efficient, I increasing oil recovery but it must be comparative economic study to know which surfactant is more profitable.
Comparative economic study for used surfactant |
||||||
|
Core |
Used surfactant |
Concentration ppm |
Cost Eur |
Cumulative oil produced bbl |
Profit Eur=amount bbl*cost of bbl (36.26) |
Net cash flow=profit-cost |
|
1 |
Cetyl trimethyl ammonium bromide |
20000 |
22.5 |
0.01725 |
0.625485 |
-21.8745 |
|
2 |
Dodecyl benzene sulfonic |
10000 |
0.6 |
0.023 |
0.83398 |
0.2398 |
|
3 |
Cytel trimethyl ammonium bromide |
10000 |
11.25 |
0.017225 |
0.625485 |
-10.624515 |
|
4 |
Dodecyl benzene sulfonic |
20000 |
1.2 |
0.0129375 |
0.469 |
-0.731 |
|
5 |
A mixture of two surfactants |
10000 |
5.9 |
0.0414 |
1.5569 |
-4.3431 |
Analysis of economic study
For surfactant cetyl trimethyl ammonium bromide: the cost is high that the company will lose money if use this surfactant in reserve 1 and 3 that the concentration has no effect on oil produced. For surfactant dodecyl benzene sulfonic: in reservoir 2 and 4, the lower concentration will be profitable than the higher concentration. For a mixture of the 2 surfactants: the mixture gives higher cumulative oil production but using this mixture in reservoir 5 is leading to losing money because the reservoir has a very low permeability value.
Conclusion
There are many techniques of EOR to increase oil recovery after primary and/or secondary methods to maximize profit. Although, many challenges should be considered before the beginning of any project to check its technical and economic viability. The surfactant flooding program is very useful in increasing oil recovery because the surfactant could increase the wettability of rock to water and that decreases the interfacial tension but in the design program the economic study must be done to know of the project is profitable or not. To design a surfactant flooding program identifying the suitable type of surfactant that may be anionic, cationic, non-anionic, or amphoteric with a suitable concentration and knowing the reservoir rock and fluid properties is very important to make a good design program. The experimental work at this project is very important to know the rock properties and know the cumulative oil produced to calculate the profit from the increased amount of oil by surfactant flooding, by making 5 cores as a reservoir and calculate the volume of oil produced after injection. Using a computer programming application (MATLAB) is very important to know the results of surfactants' effect on rock wettability from relative permeability versus saturation curves, also to know the increase of oil recovery after injecting surfactant. Making economic study is very important to measure the success of the project that may be the specified surfactant may give a high amount of produced hydrocarbon but because of its cost, the project may take money higher than the profit.
References
1. Alagorni AH, Yaacob ZB, Nour AH. 2015. An overview of oil production stages: enhanced oil recovery techniques and nitrogen injection. International Journal of Environmental Science and Development 6: 693-701.
2. L.W.Lake. 1980. Enhanced oil recovery.
3. Mischenko. 2001. Enhanced oil recovery methods.
4. Eremin N. 2001. Enhanced Oil Recovery Methods. Moscow.
5. Sunil AA. 2003. Enhanced oil recovery challenges. Saudi: Aramco.
6. Mokheimer EMA. 2019. A Comprehensive Review of Thermal Enhanced Oil Recovery: Techniques. Journal of Energy Resources Technology, Transactions of the ASME. 539-542.
7. Ramage w, Castanier L, Ramy. 1987. Economic Evaluation of Thermal Recovery Projects. Society of Petroleum Engineers. Texas: SPE Annual Technical Conference. 1-3.
8. Donaldson. 1989. Enhanced Oil Recovery. Amesterdam: Elseiver B.V.
9. Holm L. 1959. Carbon Dioxide Solvent Flooding for Increased Oil Recovery. Texas: socity of petroleum engineers. 225-228.
10. Shah D. 1977. Improved oil recovery by surfactant and polymer flooding. New York: Acadmic Press INC.
11. Afeez O. Gbadamosi RJ, Muhammad A. 2019. Manan, Augustine Agi & Adeyinka S. Yusuff. An overview of chemical enhanced oil recovery: recent advances and prospects. International Nano Letters. 171-202.
12. El-hoshoudy AN SG, Omar Ahmed Selim,. Desouky sm. 2019. Application of acrylamide polymer grafted with sio2 nanoparticles in enhanced oil recovery- design project. petroleum and coal. 1: 1505-1520.
13. El-hoshoudy AN SG, Hassan A, Attia AM. 2019. Effects of alkaline/polymer/nanofluids on oil recovery at harsh reservoir conditions. Petroleum and coal. 61: 1556-1567.
14. El-hoshoudy AN e, Zaki G, elsaeed sm. 2019. Biopolymers composites as oil improving candidates-article review. Journal of petroleum and coal. 61:1365-1377.
15. El-hoshoudy AN EGZ, Elsaeedb SM. 2020. Experimental and Monte Carlo simulation of palmitate-guar gum derivative as a novel flooding agent in the underground reservoir. J Mol Liq.
16. El-hoshoudy AN MMM, Desouky SM, Ramzi M, et al. 2019. Experimental, modeling, and simulation investigations of a novel surfmer-co-poly acrylates crosslinked hydrogels for water shut-off and improved oil recovery. J Mol Liq. 277: 142-156.
17. El-hoshoudy AN RH, Fathy M, Abdelraheem OH, et al. 2019. Enhanced oil recovery using polyacrylates/ACTF crosslinked composite: Preparation, characterization, and coreflood investigation. JPet science.
18. El-hoshoudy AN SG, Taha M. 2019. Improving Oil Recovery using Zeolite Nanoparticles Flooding. Petroleum & Petrochemical Engineering Journal. 3: 1-14.
19. El-hoshoudy AN SMD. 2018. Synthesis and evaluation of acryloylated starch-g-poly (Acrylamide/ Vinylmethacrylate/1-Vinyl-2-pyrrolidone) crosslinked terpolymer functionalized by dimethylphenylvinylsilane derivative as a novel polymer-flooding agent. Int J Biol Macromol. 116: 434-442. Ref.: https://pubmed.ncbi.nlm.nih.gov/29758308/ DOI: 10.1016/j.ijbiomac.2018.05.056
20. el-hoshoudy AN SMD, Attia AM. 2018. Synthesis of starch functionalized sulfonic acid co-imidazolium/silica composite for improving oil recovery through chemical flooding technologies. Int J Biol Macromol. Ref.: https://pubmed.ncbi.nlm.nih.gov/29990554/ DOI: 10.1016/j.ijbiomac.2018.07.009
21. El-hoshoudy AN SMD. 2018. CO2 Miscible Flooding for Enhanced Oil Recovery. Carbon Capture, Utilization and Sequestration. Intech open.
22. El-hoshoudy AN SMD, 2019. Gomaa S. Application of Acrylates in Enhanced Oil Recovery. Journal of New Development in chemistry. 2: 1-17.
23. A.N.El-hoshoudy FSS, Mansour EM, Zaki T, et al. 2019. Experimental and theoretical investigation of quaternary ammonium-based deep eutectic solvent for secondary water flooding. J Mol Liq. 294: 111621.
24. El Hoshoudy A, Desouky S, Al-Sabagh A, et al. 2015. Synthesis and Characterization of Polyacrylamide Crosslinked Copolymer for Enhanced Oil Recovery and Rock Wettability Alteration. International Journal of Oil, Gas and Coal Engineering. 3: 47-59.
25. El-Hoshoudy A. 2020. Investigating the potential antiviral activity drugs against SARS-CoV-2 by molecular docking simulation. J Mol Liq. 113968. Ref.: https://pubmed.ncbi.nlm.nih.gov/32839634/ DOI: 10.1016/j.molliq.2020.113968
26. El-hoshoudy A, Desouky S, Alsabagh A, et al. 2017. Evaluation of solution and rheological properties for hydrophobically associated polyacrylamide copolymer as a promised enhanced oil recovery candidate. Egyptian Journal of Petroleum.
27. El-Hoshoudy A, Desouky S, Betiha M, et al. 2016. Use of 1-vinyl imidazole based surfmers for preparation of polyacrylamide–SiO2 nanocomposite through aza-Michael addition copolymerization reaction for rock wettability alteration. Fuel. 170: 161-175.
28. El-Hoshoudy A, Desouky S, Elkady M, et al. 2015. Investigation of optimum polymerization conditions for synthesis of cross-linked polyacrylamide-amphoteric surfmer nanocomposites for polymer flooding in sandstone reservoirs. International Journal of Polymer Science.
29. El-hoshoudy A, Desouky S, Elkady M, et al. 2017. Hydrophobically associated polymers for wettability alteration and enhanced oil recovery–Article review. Egyptian Journal of Petroleum.
30. El-hoshoudy A, Gomaa S, Taha M. 2019. Improving oil recovery using fe2o3 nanoparticles flooding. Petroleum & coal. 61.
31. El-hoshoudy A, Mansour E, Desouky S. 2020. Experimental, computational and simulation oversight of silica-co-poly acrylates composite prepared by surfactant-stabilized emulsion for polymer flooding in unconsolidated sandstone reservoirs. J Mol Liq. 113082.
32. El-hoshoudy A, Zaki E, Elsaeed S. 2019. Biopolymers composites as oil improving candidates-article review. Petroleum & coal. 61.
33. el-hoshoudy an. 2018. Quaternary ammonium based surfmer-co-acrylamide polymers for altering carbonate rock wettability during water flooding. J Mol Liq.
34. el-hoshoudy AN. 2019. Synthesis of acryloylated starch-g-poly acrylates crosslinked polymer functionalized by emulsified vinyltrimethylsilane derivative as a novel EOR agent for severe polymer flooding strategy. Int J Biol Macromol. 123: 124-132. Ref.: https://pubmed.ncbi.nlm.nih.gov/30439420/ DOI: 10.1016/j.ijbiomac.2018.11.056
35. El-hoshoudy AN. 2019. Synthesis and Fabrication of Silica Based Superhydrophobic Surfaces. Petroleum & Petrochemical Engineering Journal. 3.
36. El-hoshoudy AN, desouky SM. 2019. Pvt properties of black crude oil-a review. Petroleum and coal. 61: 1282-1299.
37. El-hoshoudy AN. 2019. Application of proteins in enhanced oil recovery-a review. Petroleum and coal. 61: 1268-1281.
38. El-hoshoudy AN, Desouky SM, Betiha MH, et al. 2017. Hydrophobic Polymers Flooding. Application and Characterization of Surfactants InTechopen. 75-95.
39. El-hoshoudy AN DS, Attia AM, SG. 2018. Synthesis and Evaluation of Xanthan-G-Poly (Acrylamide) CoPolymer for Enhanced Oil Recovery Applications. Petroleum & Petrochemical Engineering Journal. 2.
40. Hamdy A SM, Mohamed K, El-hoshoudy AN. 2019. Evaluation of Waterflooding; Experimental and Simulation Overview. Petroleum & Petrochemical Engineering Journal. 3:196.
41. Noha Khedr OA, Moamen Badr, Ibrahim Hamza, et al. 2019. el-hoshoudy design and economical evaluation of biopolymer injection-design project. petroleum and coal. 61: 1528-1545.
42. Soliman AA, El-Hoshoudy AN, Attia AM. 2020. Assessment of xanthan gum and xanthan-g-silica derivatives as chemical flooding agents and rock wettability modifiers. Oil & Gas Science and Technology–Revue d’IFP Energies nouvelles. 75: 12.
43. Caenn R, Burneit, chilingauruan. 1985. polymer flooding. Enhanced oil recovery II processes and operations. New york: ELseiver. 157-168.
44. Litmann W. 1988. polymer flooding. Amesterdam: Eliseiver.
45. ong D, G.Z. 2014. infulence of oil viscosity on alkaline flooding.
46. Mohammad Sedaghat AA. 2013. Aspects of alkaline flooding: Oil recovery improvement and displacement. Middle-East Journal of Scientific Research. 258-263.
47. Schramm LL. 2004. surfactant and its applications. canada: university of Calgary, Dept. of Chemical & Petroleum Engineering.
48. Tcholakova NDDaS. 2010. Surfactants-classification,. Bulgaria: Sofia University.
49. Moustafa HM. 2017. Oil Recovery by Surfactant Flooding; Sensitivity. United Arab Emirates United Arab Emirates University.
50. Darmstadt. 2020. Hexadecy ltrimethy lammonium bromide. Merck.