
-
Mail us:
editor@raftpubs.org
Indexing & Abstracting
Full Text
Case ReportDOI Number : 10.36811/jcshd.2022.110025Article Views : 2Article Downloads : 2
Pseudo ST segment elevation and terminal negative deflection of T wave during treadmill test could be due to damping problem in the printer
SR Mittal1* and Govind Mittal2
1Department of Cardiology, Mittal Hospital & Research Centre, Pushkar Road, Ajmer (Raj.) -305001, Pune
2Gokhale Institute of Polytical Sciences and Economics, Pune
*Corresponding Author: SR Mittal, Department of Cardiology, Mittal Hospital & Research Centre, Pushkar Road, Ajmer (Raj.) -305001, Pune; Email: drsrmittal@gmail.com
Article Information
Aritcle Type: Case Report
Citation: SR Mittal, Govind Mittal. 2022. Pseudo ST segment elevation and terminal negative deflection of T wave during treadmill test could be due to damping problem in the printer. J Cardiovasc Surg Heart Dis. 4: 09-52.
Copyright: This is an open-access article distributed under the terms of the Creative Commons Attribution License, which permits unrestricted use, distribution, and reproduction in any medium, provided the original author and source are credited. Copyright © 2022; SR Mittal
Publication history:
Received date: 22 January, 2022Accepted date: 10 February, 2022
Published date: 15 February, 2022
Abstract
ST segment elevation during treadmill stress testing, in the leads without Q waves, is considered suggestive of transmural ischemia due to high grade proximal coronary arterial lesions. We observed six consecutive, asymptomatic individuals who had ST segment elevation and terminal negative deflection of the T waves in leads V1 to V3 during treadmill stress testing. Resting electrocardiograms recorded from another machine just before treadmill test were normal. Detailed echocardiographic evaluation just before treadmill test did not reveal any regional wall motion abnormalities in any case. All patients could complete the stress test without any clinical or electrocardiographic signs of ischemia. After careful analysis of resting electrocardiograms, clinical profile, heart rate and blood pressure responses and electrocardiographic findings during stress test, we felt that ST segment elevation and terminal negative deflection of the T wave recorded only during treadmill test were artefacts due to under damping (overshoot) of the stylus of the printer of the particular treadmill stress test system. Detailed findings are given and differential diagnosis is discussed. Repair resulted in normal tracing in subsequent patients.
Keywords: Artefacts; Electrocardiography; Stress test; ST segment; T wave; Treadmill test
Introduction
During treadmill stress testing, ST segment elevation in leads without Q waves suggest a high grade proximal coronary arterial lesion. It is advised that exercise should be terminated if one mm or more of ST segment elevation occurs with continuation of exercise and carries a substantial risk to the patient [1]. We observed ST segment elevation with terminal negative deflection of the T wave in leads V1 to V3 in six consecutive persons who had treadmill stress tests performed on the same system. After careful consideration of clinical profiles, resting electrocardiograms recorded from another machine and responses to stress testing we felt that the electrocardiographic abnormalities recorded during stress testing were due to underdamping of styli of the printer. Repair resulted in normal recording in subsequent patients. Details of all cases is given and differential diagnosis is discussed.
Case Reports
Case-1
A 50 years old male presented for evaluation of atypical chest pain. He had no cardiovascular risk factors. Family history was not contributory. Resting pulse rate was 75 beats/minute and resting supine blood pressure was 120/80 mm Hg. Cardiac examination was normal. Echocardiographic evaluation revealed mildly impaired relaxation of left ventricle (Figure 1 and 2). There were no other abnormalities. There was no regional wall motion abnormality (Figure 3 and 4). Treadmill test was performed using the Bruce protocol. Supine electrocardiogram (Figure 5) showed minimal elevation of ST segment in lead V1 (marked arrow) However, simultaneously printed median beats recorded at the top of the figure did not show any ST segment elevation in lead V1. Patient could exercise for eight minutes (9.2 METs). Peak heart rate was 145 beat/minute (85% of age predicted maximal heart rate). Predicted maximal heart rate was calculated by the formula of Fox et al2 as 220- age. Peak blood pressure was 160/80 mm Hg. Heart rate recovery was normal. There were no symptoms during and after exercise. Review of raw ECGs showed ST segment elevation (marked) and negative deflection of the terminal part of the T wave (marked ) in leads V1 to V3 during stage 1 (Figure 6). Other leads did not show any change. Median beats recorded at the same time also did not show any abnormality in leads V1 to V3. ST segment elevation persisted during exercise (Figure 7) and recovery (Figure 8). Other leads did not show any change. Medain beats recorded at the same time at the top of figure did not show any abnormality. We did not have any satisfactory explanation. We immediately recorded another ECG from another machine. It was normal (Figure 9). We kept the patient under observation for two hours. He did not develop any symptoms. We felt that the ST segment and T wave changes could be on artefact. We analysed subsequent stress tests performed on the same treadmill stress test system.

Figure 1: Pulsed Doppler evaluation of mitral valve flow showing impaired relaxation of LV. E wave velocity-0.68m/s, a wave velocity - 0.81 m/s.

Figure 2: Tissue Doppler imaging of medial mitral annulus showing impaired relaxation of LV. Sa velocity 0.12m/s, Ea velocity - 0.08 m/s Aa velocity - 0.09 m/s.

Figure 3: Apical four chamber views at end-diastole (a) and at end-systole (b) showing normal wall motion. LA- left atrium, LV- left ventricle, RA - right atrium, RV- right ventricle.

Figure 4: Showing short axis views at end - diastole (a) and at end-systole showing normal wall motion. LV- left ventricle, RV- right ventricle.

Figure 5: Electrocardiogram in supine position during treadmill test showing mild ST segment elevation in lead V1 (marked). Median beats recorded in the top part of the Figure did not show any abnormality in lead V1.

Figure 6: Electrocardiogram during stage 1, showing ST segment elevation (marked) and negative deflection of terminal part of T wave (marked) in leads V1 to V3. Median beats recorded in the top part of the Figureure did not show any abnormality.
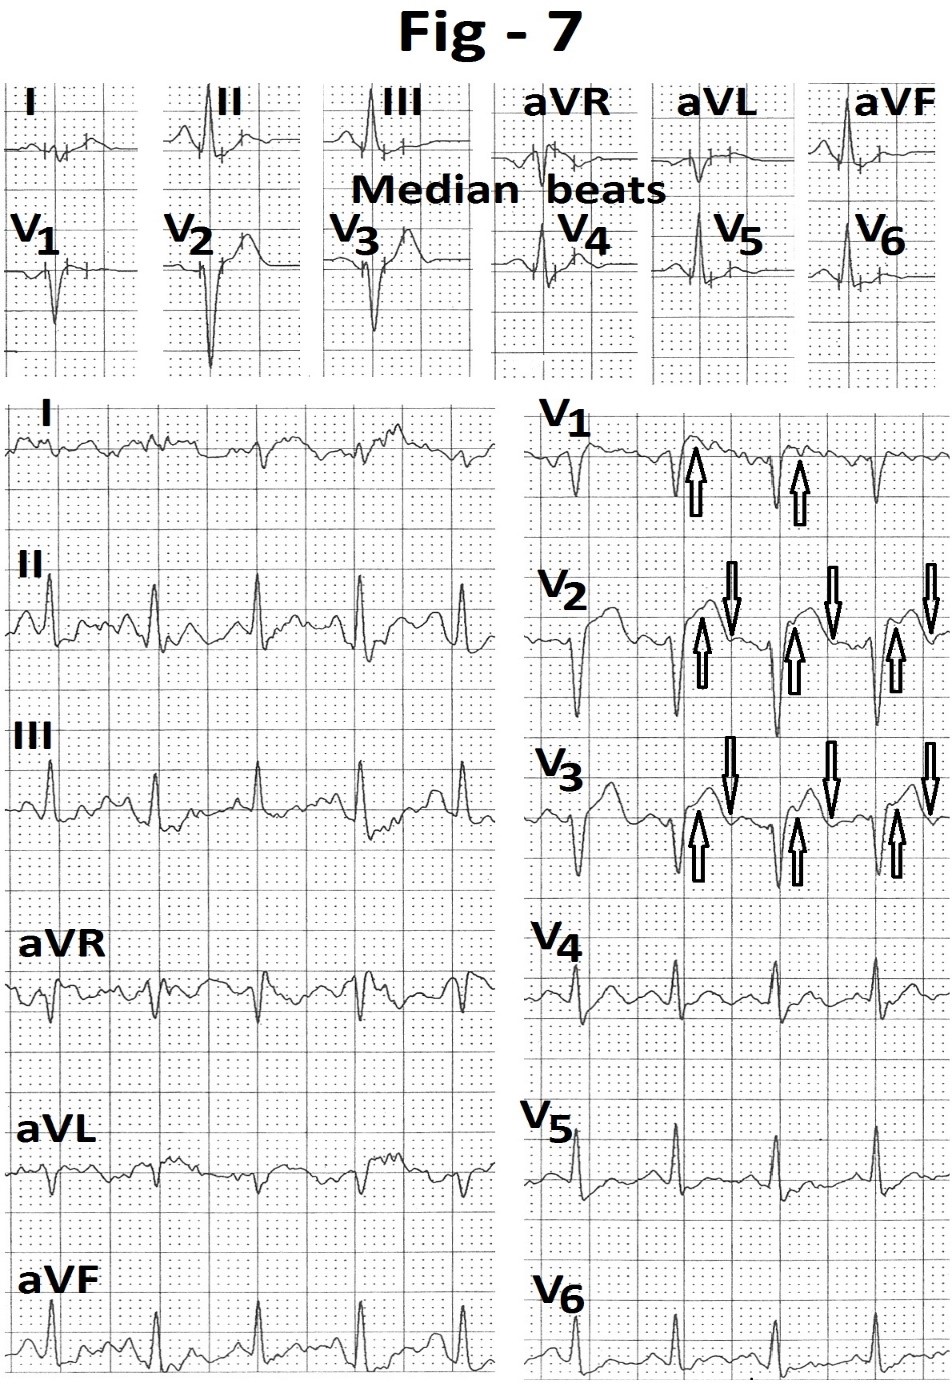
Figure 7: Electrocardiogram recorded at peak exercise showing persistence of ST segment elevation (marked) and terminal negative T wave (marked) in leads V1 to V3. Median beats recorded in top part of the Figureure do not show any abnormality.
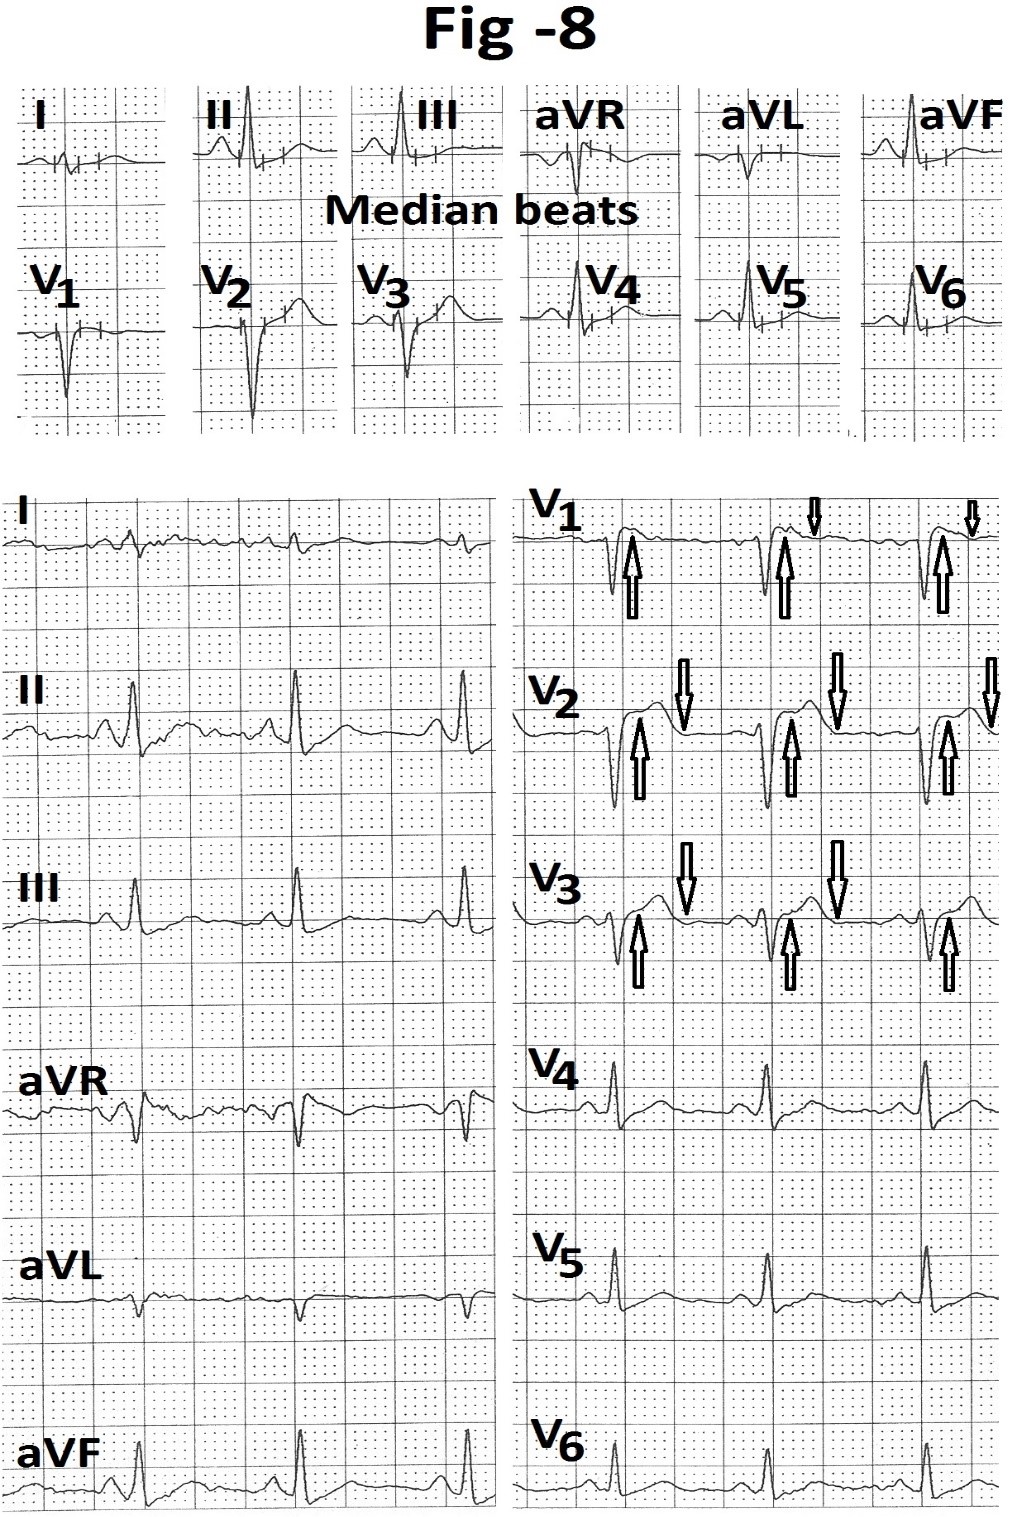
Figure 8: Electrocardiogram recorded during third minute of recovery showing persistence of ST segment elevation (marked) and terminal negative T wave (marked) in leads V1 to V3. Median beats recorded in top part of the Figureure do not show any abnormality.
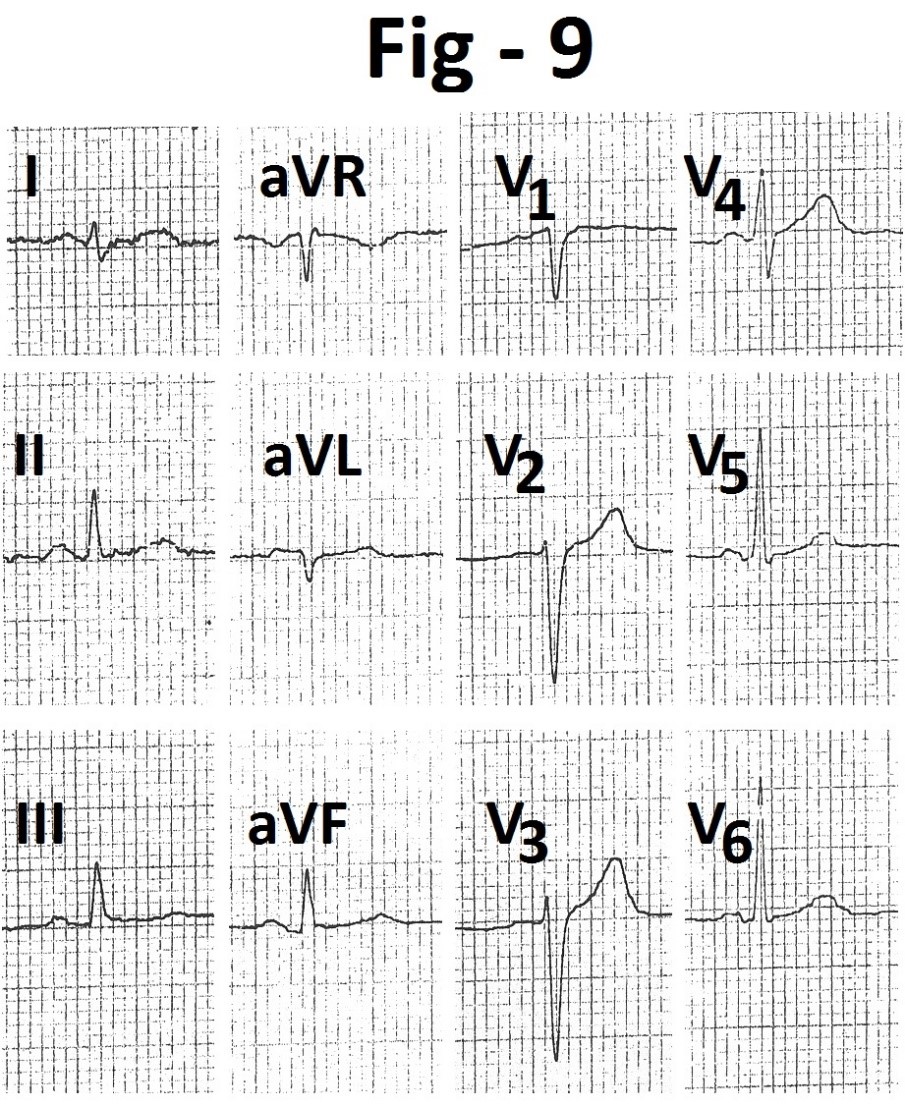
Figure 9:Electrocardiogram recorded from another machine immediately after treadmill test. It shows normal electrocardiogram.
Case-2
A 52 years old hypertensive female presented for cardiac evaluation. Echocardiographic examination was normal except mild concentric left ventricular hypertrophy. There was no regional wall motion abnormality (Figure 10 and 11). Resting electrocardiogram done from another machine just before treadmill test (Figure 12) showed relative decrease in amplitude of the T waves in leads aVL and V4 to V6. During treadmill testing, resting supine heart rate was 67 beats/minute. Resting supine blood pressure was 150/90 mm Hg. Supine electrocardiogram (Figure 13) showed shallow T wave inversion in leads V4 and V5. Lead V6 showed mild depression of the ST segment. Patient could exercise for 3:12 minutes (4.9 Mets). Exercise was terminated because of breathlessness. Peak heart rate was 127 beat/minute (76% of the age predicted maximal heart rate). Peak blood pressure was 160/90 mm Hg. Heart rate recovery was normal. During exercise (Figure 14) there was mild elevation of the ST segment (marked) and negative deflection of terminal part of the T waves (marked) in leads V1 to V3 with up sloping ST segment depression in leads II, III and aVF (marked). Changes became more prominent during first minute of recovery (Figure 15 and 16) and persisted up to six minutes of recovery. Once again, median beats recorded at the same time at the top of the figures did not show any change in leads V1 to V3.
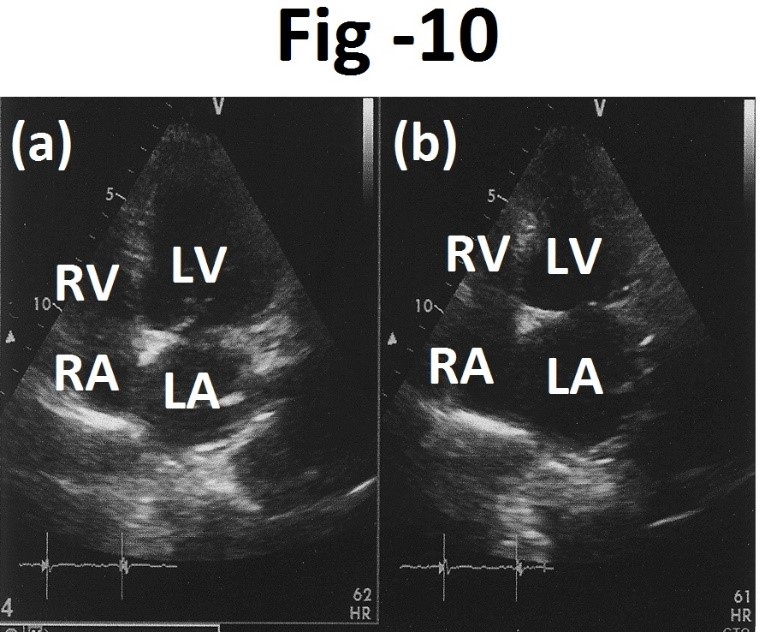
Figure 10: Apical four chamber views at end-diastole (a) and at end-systole (b) showing normal wall motion. LA- left atrium, LV- left ventricle, RA - right atrium, RV- right ventricle.
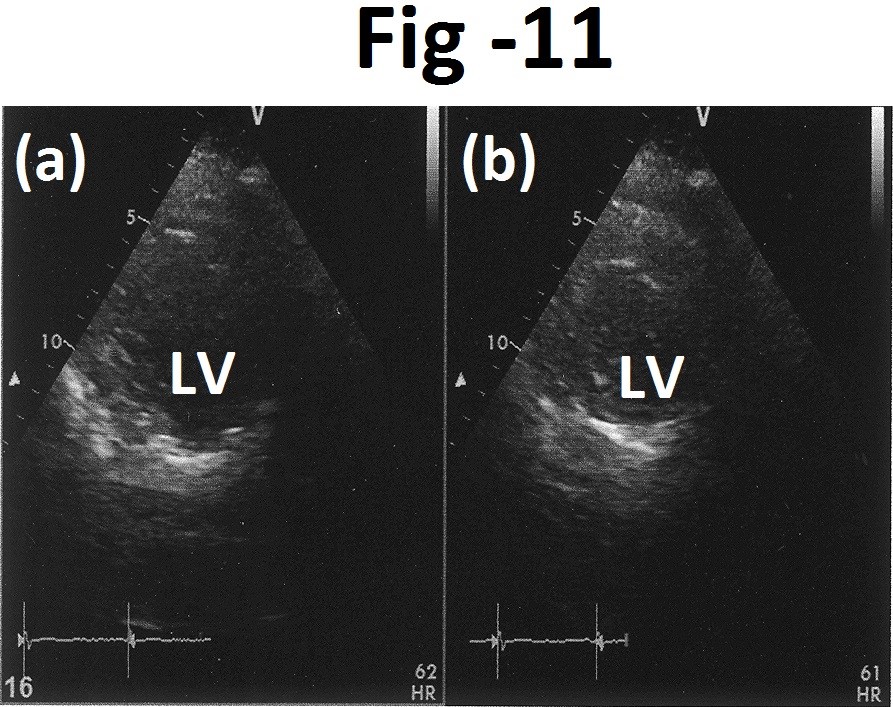
Figure 11: Short axis views at end-diastole (a) and end-systole (b) showing normal wall motion. LV- left ventricle.
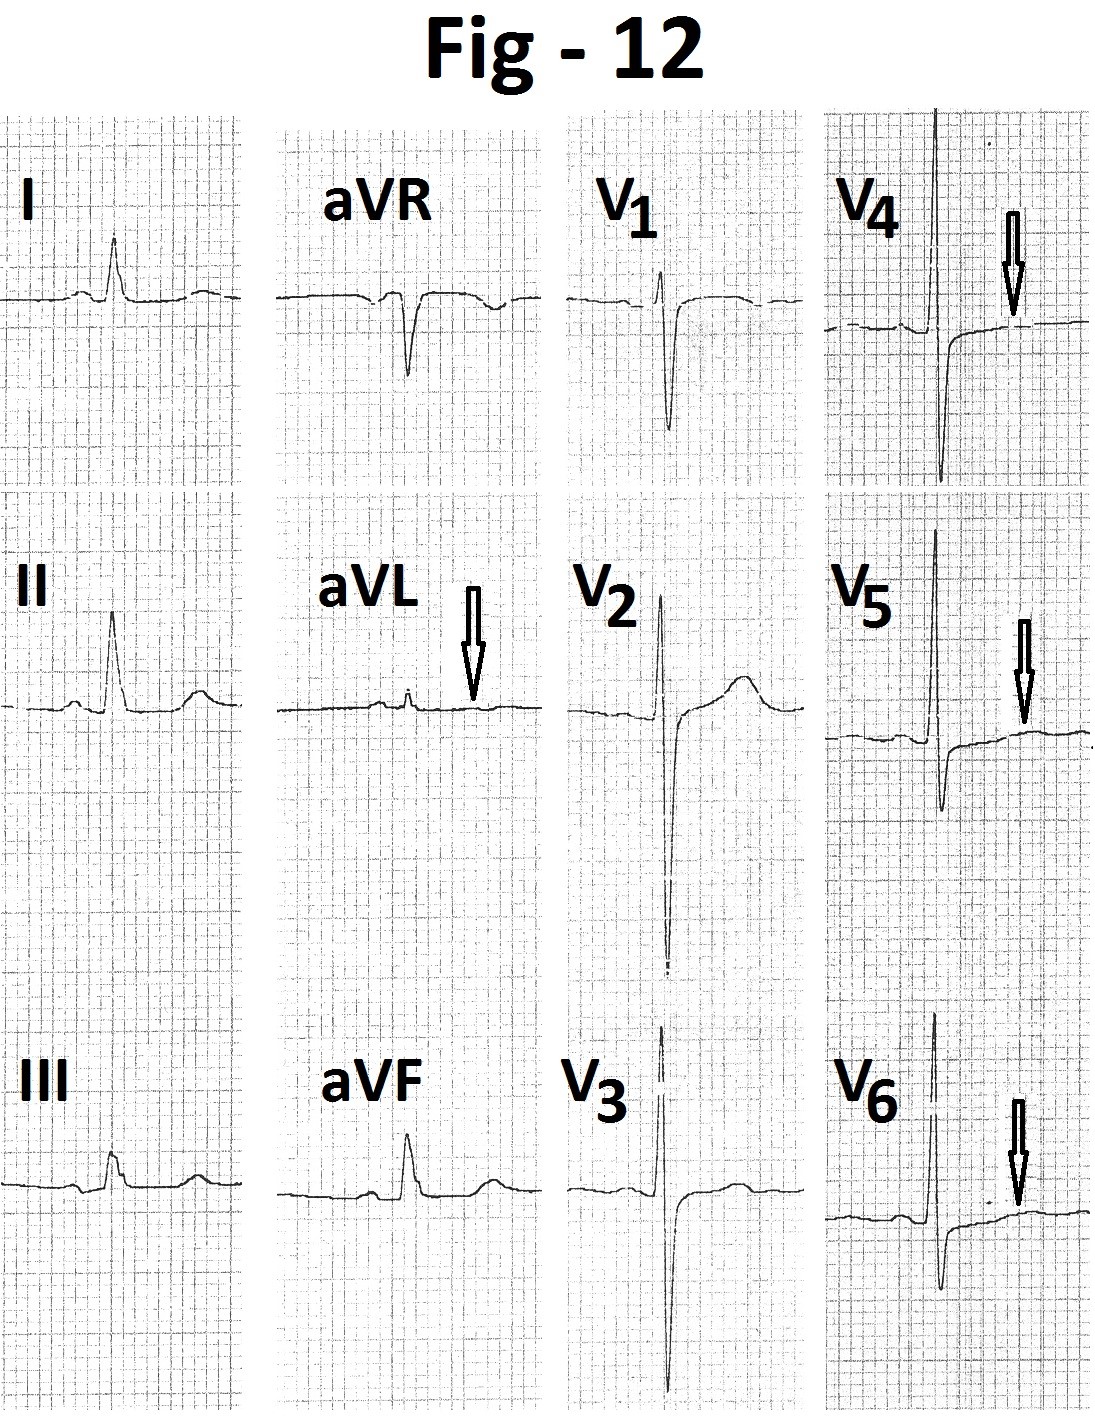
Figure 12: Resting electrocardiogram showing decreased amplitude of T wave in leads aVL and V4 to V6 (marked).
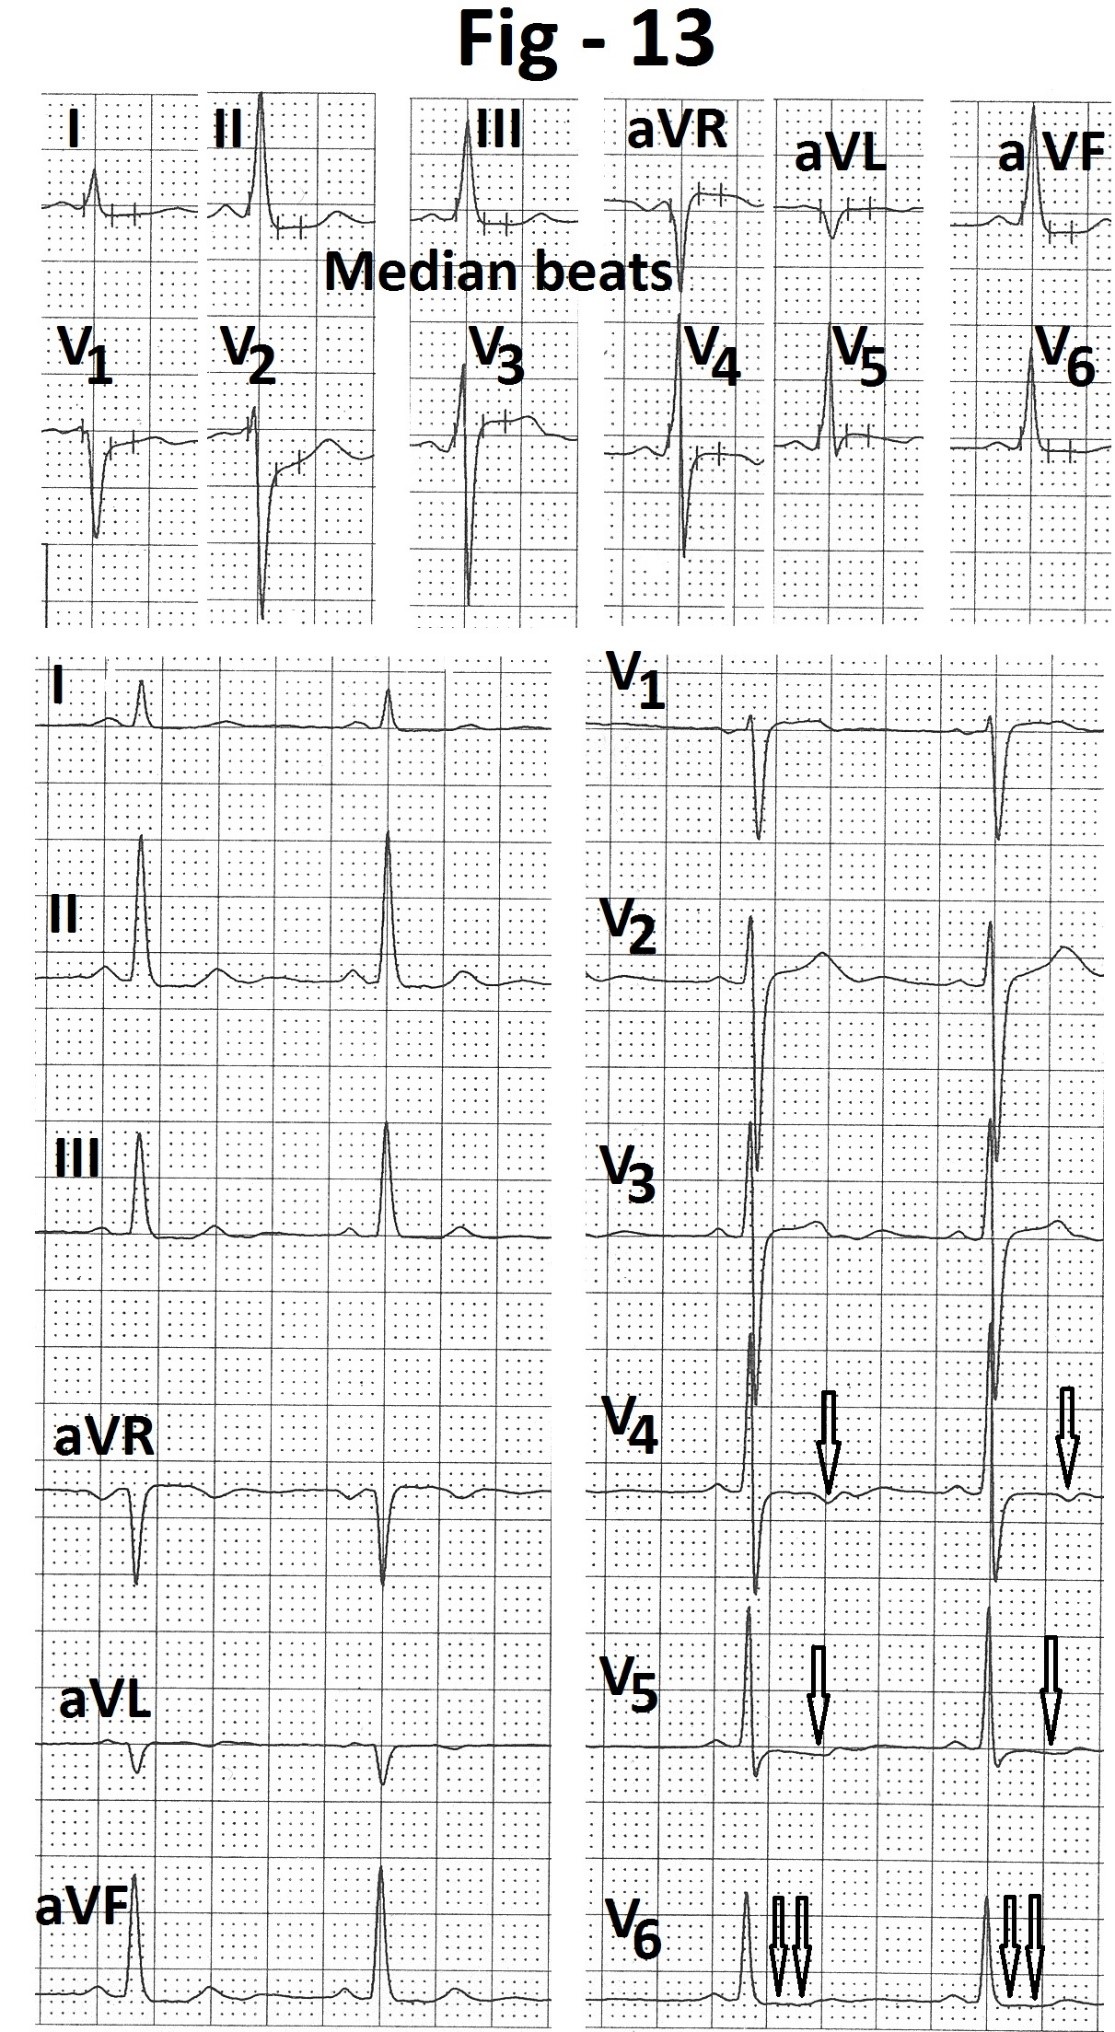
Figure 13: Electrocardiogram in supine position during treadmill test showing shallow T wave inversion in leads V4 and V5 (marked) and mild depression of ST segment in lead V6 (marked).

Figure 14: Electrocardiogram at peak exercise showing ST segment elevation (marked) and terminal negative deflection of T wave (marked) in leads V1 to V3. There is slow up sloping ST segment depression in leads II, III, aVF and V6 (marked). Median beats recorded at the same time, at the top of Figureure do not show any abnormality in leads V1 to V3.
Case-3
A 47 years old asymptomatic male presented for evaluation of shallow T wave inversions in leads II, III, aVF and V4 to V6. Coronary angiography, done at two different centres, were normal. Echocardiography revealed mild hypertrophy of left ventricular apex (Figure 17). There were no regional wall motion abnormalities (Figure 18 and 19). Resting heart rate was 88 beats/minute and resting supine blood pressure was 120/80 mm Hg. During treadmill testing, supine electrocardiogram showed ST segment elevation (marked) in leads V1 to V3 with terminal negative deflection of the T waves (marked). However, median beats recorded at the same time, at the top of the figure, did not show any abnormality in leads V1 to V3. T waves were inverted in leads II, III, aVF and V4 to V6 (marked) (Figure 20). Patient could exercise for seven minutes (8.1 METs). Peak heart rate was 149 beats/minute (86% of the age predicted maximal heart rate). Peak blood pressure was 160/80 mm Hg. There were no symptoms during exercise and recovery. ST segment elevation and terminal negative deflection of the T waves in leads V1 to V3 remained the same during exercise (Figure 21) and recovery (Figure 22). T wave polarity in leads II, III, aVR, aVF and V4 to V6 changed during peak exercise. Other leads did not show any change. Once again median beats recorded at the same time at the top of the figure did not show any ST segment elevation or terminal negative deflection of the T waves in leads V1 to V3. ECG recorded from another machine, soon after treadmill test, also did not show any abnormality in leads V1 to V3 (Figure 23). T waves were inverted in leads II, III, aVF and V4 to V6 (marked).

Figure 15: Electrocardiogram recorded during 1st minute of recovery showing ST segment elevation (marked) and terminal negative deflection of T wave (marked ) in leads V1 to V3.
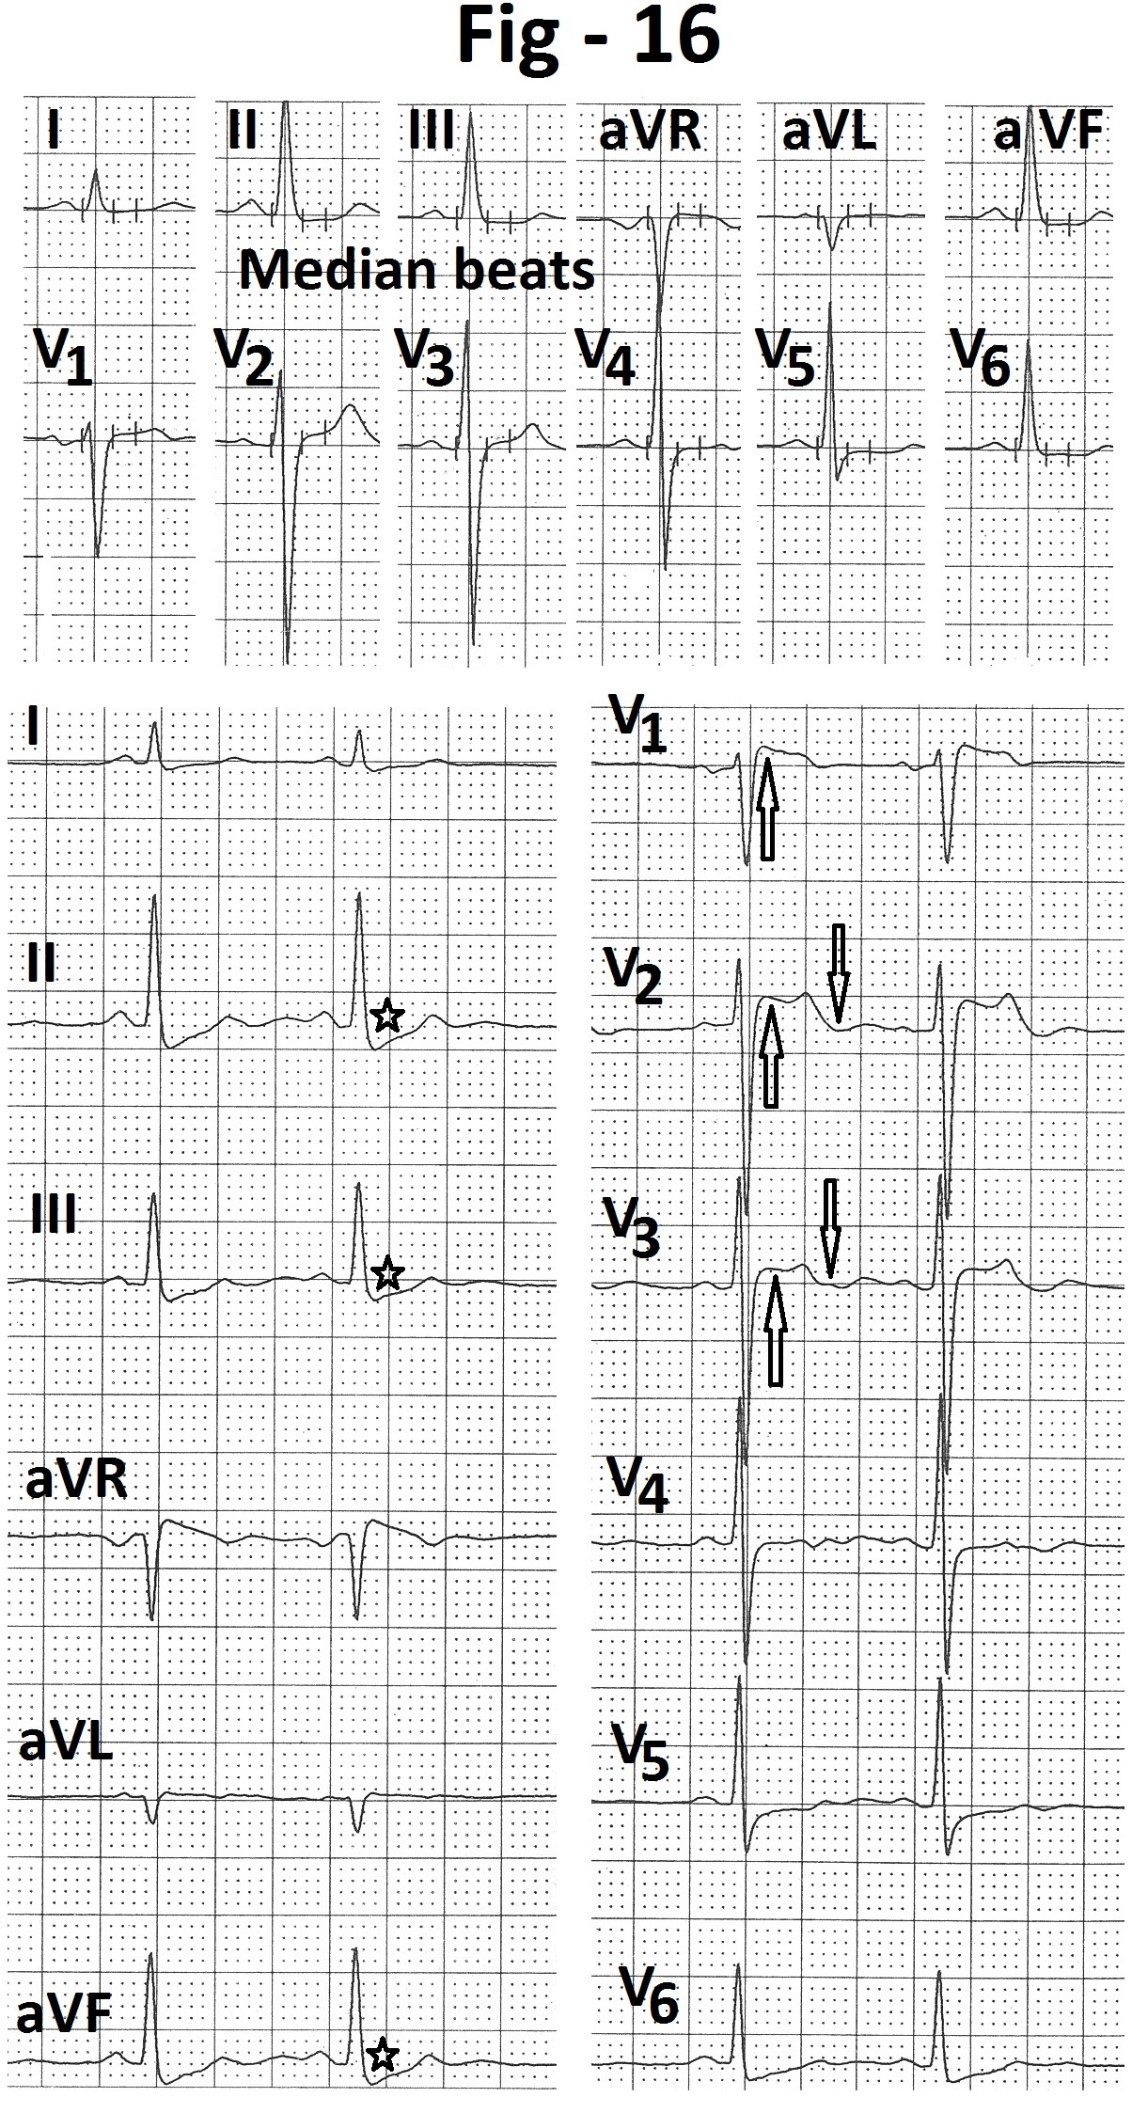
Electrocardiogram recorded during third minute of recovery showing persistence of ST segment and T wave changes in leads V1 to V3. Median beats recorded, at all same time, at the top of the Figure do not show any abnormality in leads V1 to V3.
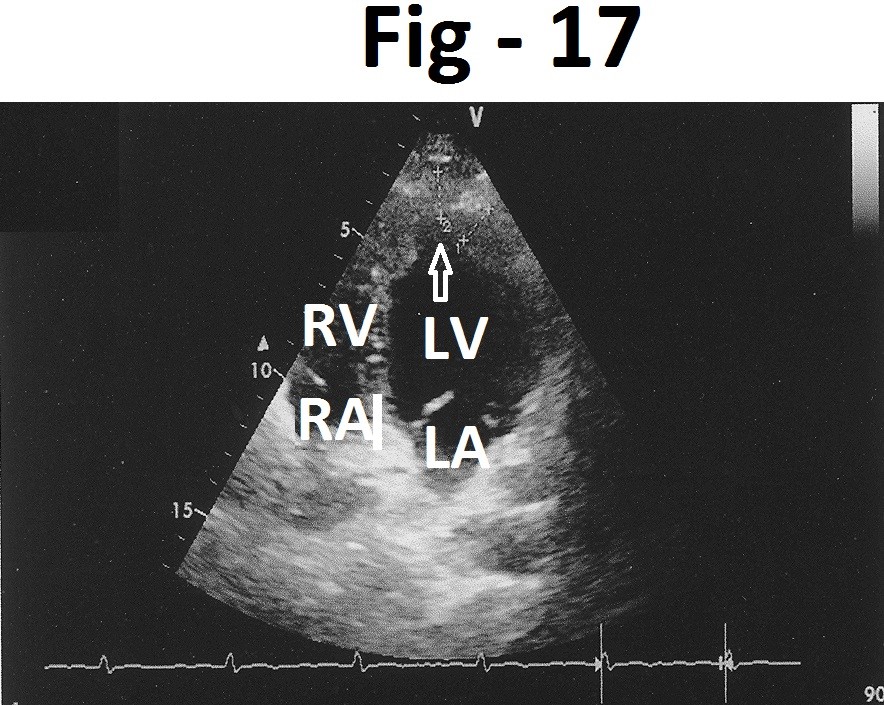
Figure 17: Modified apical four chamber view showing hypertrophy of LV apex (marked) LA- left atrium, LV- left ventricle, RA - right atrium, RV- right ventricle.
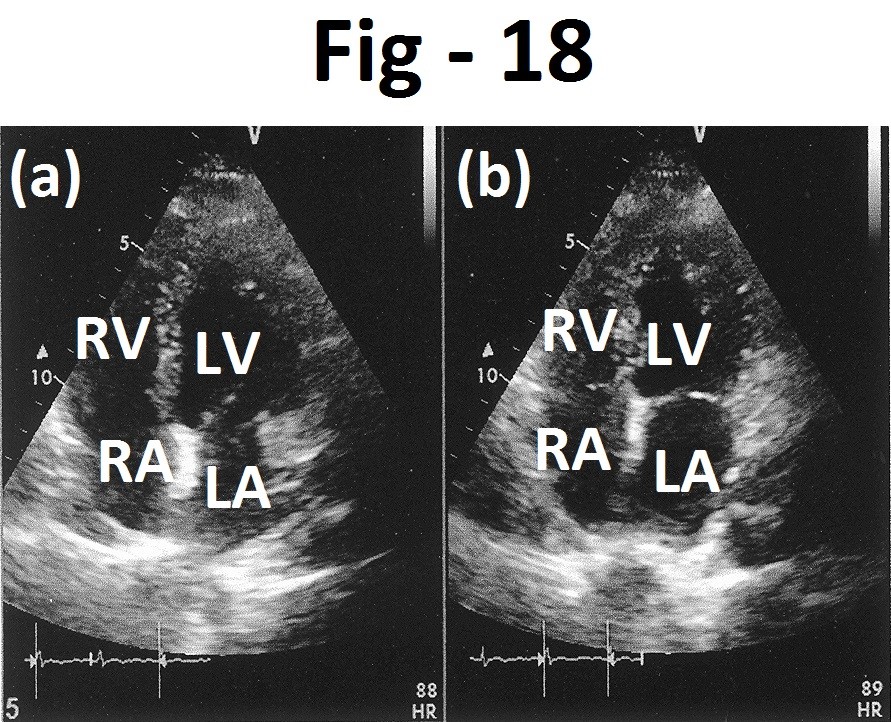
Figure 18: Apical four chamber views at end-diastole (a) and end-systole (b) showing normal wall motions. LA- left atrium, LV- left ventricle, RA - right atrium, RV- right ventricle.

Figure 19: Short axis views at end - diastole (a) and end-systole (b) showing normal wall motions. LV- left ventricle.
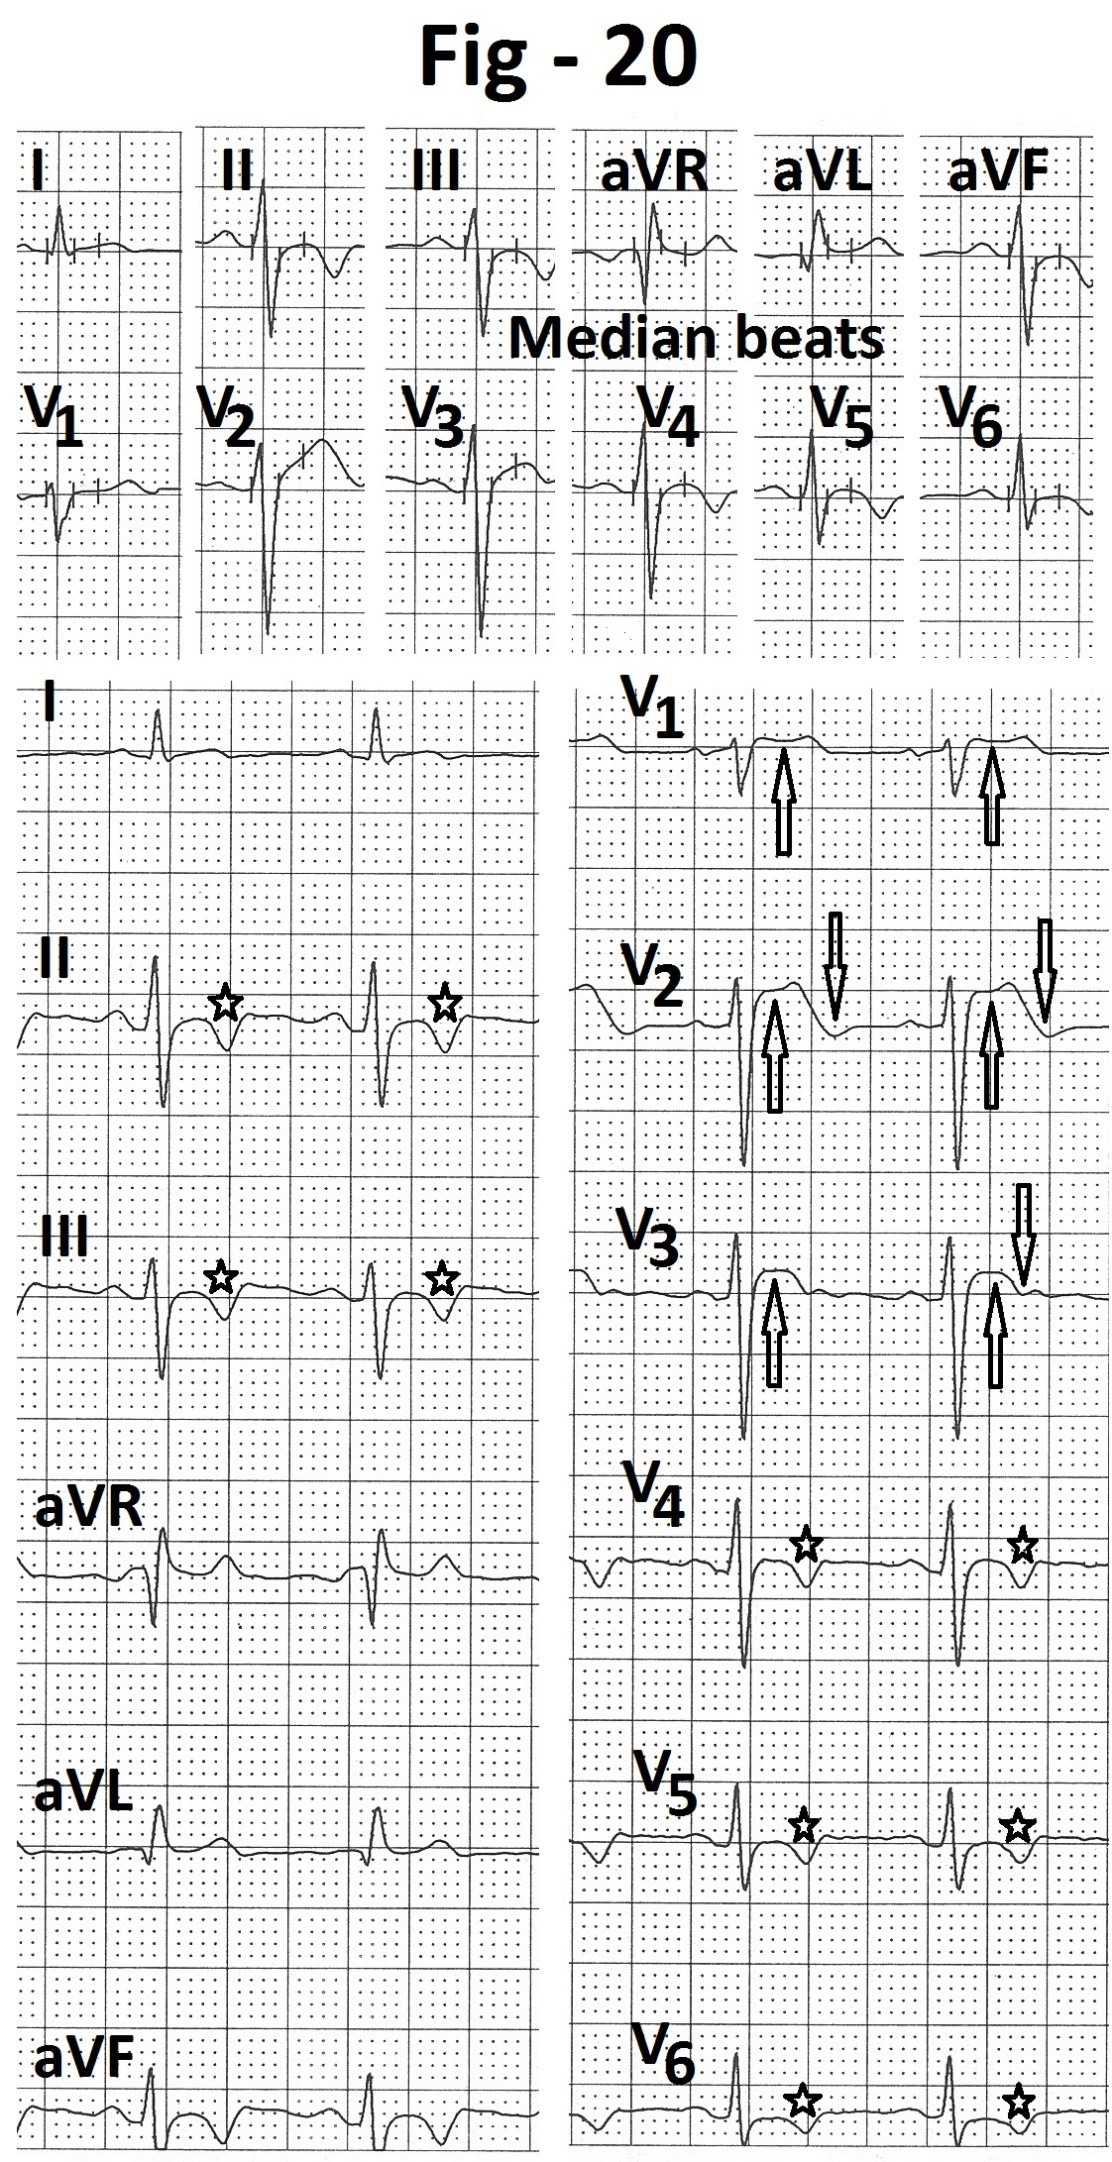
Figure 20: Supine electrocardiogram showing ST segment elevation (marked) and terminal negative deflection of T wave (marked) in leads V1 to V3. T waves are inverted in leads II, III, aVF and V4 to V6 (marked). Median beats recorded at the same time, at the top of the Figureure, do not show any change in leads V1 to V3.

Figure 21: Electrocardiogram recorded during peak exercise from case 3. There is no fresh change in ST segment elevation (marked) and terminal negative deflection of T wave (marked) leads V1 to V3. Median beats do not show any abnormality in leads V1 to V3. There is change in T wave polarity in leads II, III, aVR, aVF and V4 to V6 (marked).

Figure 22: Electrocardiogram recorded during third minute of recovery showing persistence of ST segment elevation (marked) and terminal negative deflection of T wave (marked ) in leads V1 to V3. Median beats recorded at the same time, at the top of the Figureure, do not show any abnormality in leads V1 to V3. T waves are again inverted in leads II, III, aVR, aVF and V4 to V6.

Figure 23: Electrocardiogram of case-3 recorded from another machine soon after completion of treadmill test. There is no abnormality in leads V1 to V3.
Case-4
A 62 years old hypertensive female presented with a complaint of breathlessness on effort. Echocardiography revealed impaired relaxation of the left ventricle (Figure 24 and 25). There was no regional wall motion abnormality. (Figure 26 and 27). ECG done from another machine just before taking the patient for treadmill test was normal (Figure 28). Resting pulse rate was 73 beats/minute. Resting supine blood pressure was 160/90 mm Hg. During treadmill testing, ECG in supine position showed ST segment elevation (marked ) and terminal negative deflection of the T waves (marked ) in leads V1 to V3 (Figure 29). Other leads were normal. Median beats recorded at the same time, at the top of the figure, did not show and abnormality in leads V1 to V3. Patient had no symptoms. Patient could exercise for 4:22 minutes (5.8 METs). Peak heart rate was 141 beats/minute (89% of the age predicted maximal heart rate). Peak blood pressure was 180/90 mm Hg. Heart rate recovery was normal. ST segment elevation decreased during exercise (Figure 30) but reappeared during recovery (Figure 31). However, median beats, recorded at the same time in the upper portion of the figure, did not show any abnormality in leads V1 to V3.
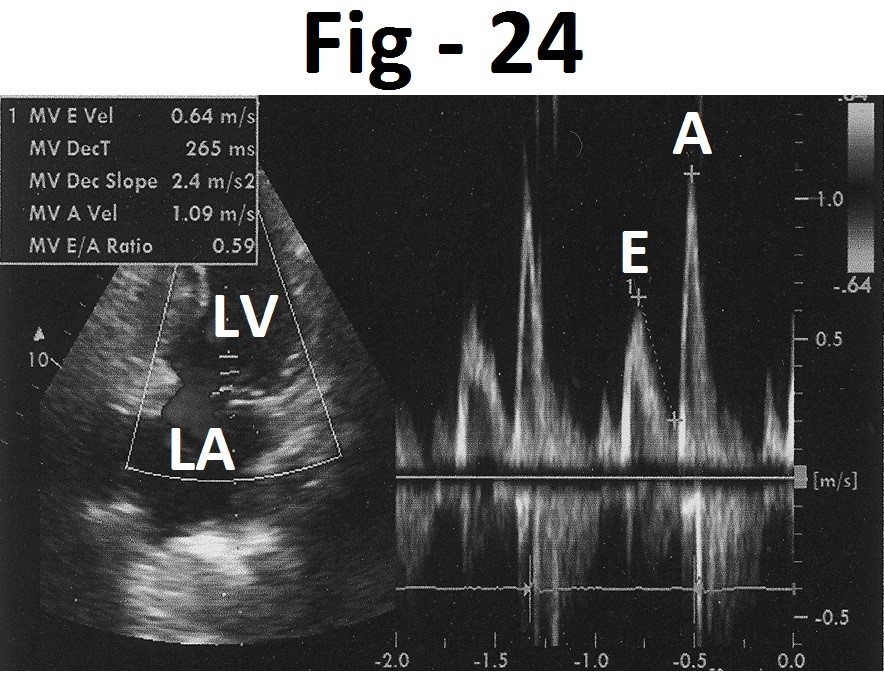
Figure 24: Pulsed Doppler evaluation of mitral valve flow showing E wave velocity 0.64 m/s and A wave velocity 1.09 m/s.
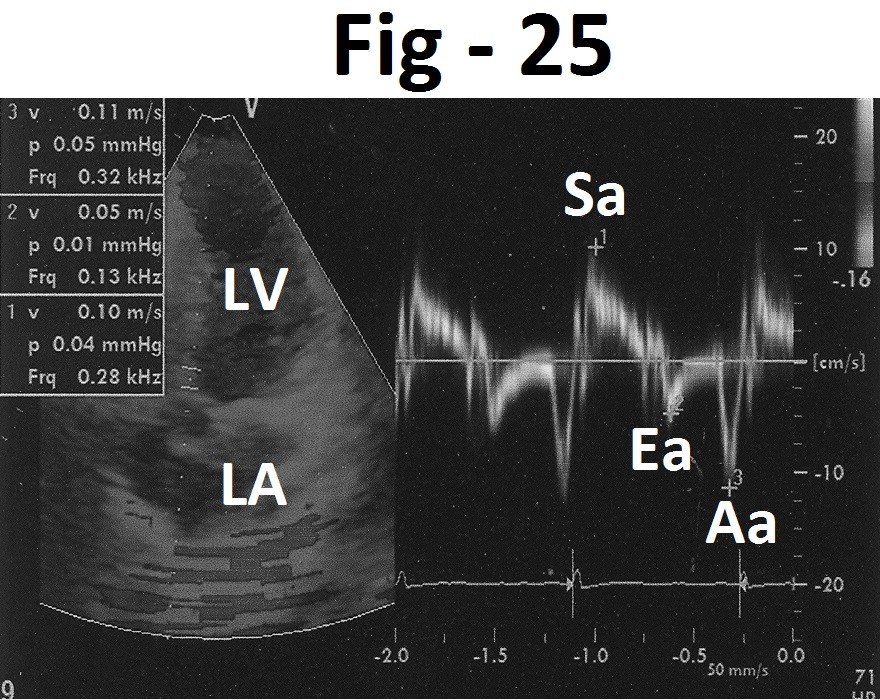
Figure 25: Tissue Doppler imaging of medial mitral annulus showing Sa velocity - 0.11 m/s, Ea velocity - 0.05 m/s, Aa velocity 0.10 m/s.
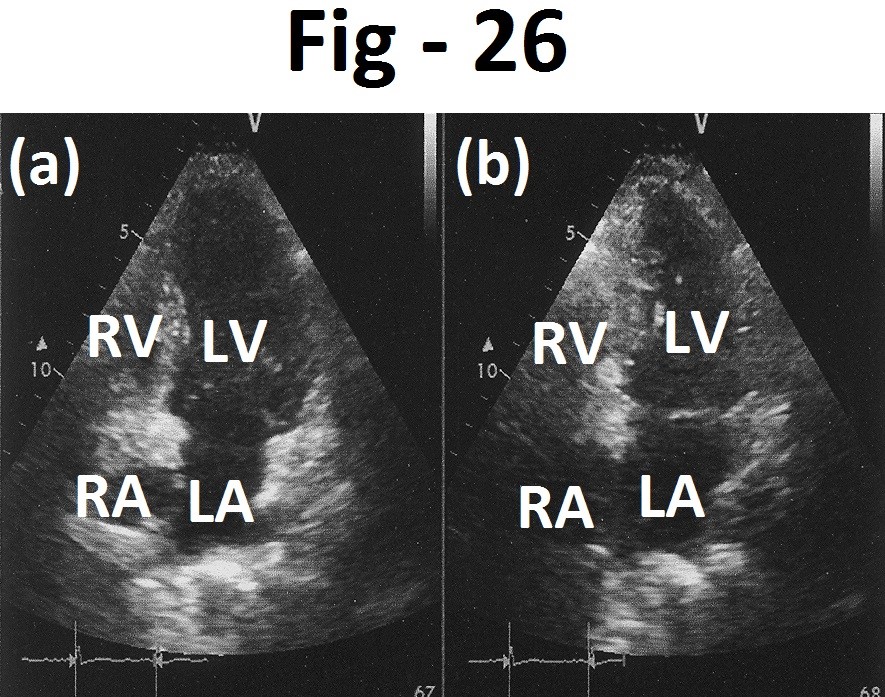
Figure 26: Apical four chamber views recorded at end-diastole (a) and at end-systole (b) showing normal wall motions. LA- left atrium, LV- left ventricle, RA - right atrium, RV- right ventricle.

Figure 27: Short axis views recorded at end-diastole (a) and at end-systole (b) showing normal wall motions. LV- left ventricle.

Figure 28: Showing normal resting electrocardiogram of case -4.

Figure 29: Supine electrocardiogram during treadmill test showing ST-segment elevation (marked) and negative deflection of terminal part of T wave (marked) in leads V1 to V3. Median beats are normal.

Figure 30: Electrocardiogram at peak exercise showing decrease in elevation of ST segment in leads V1 to V3.
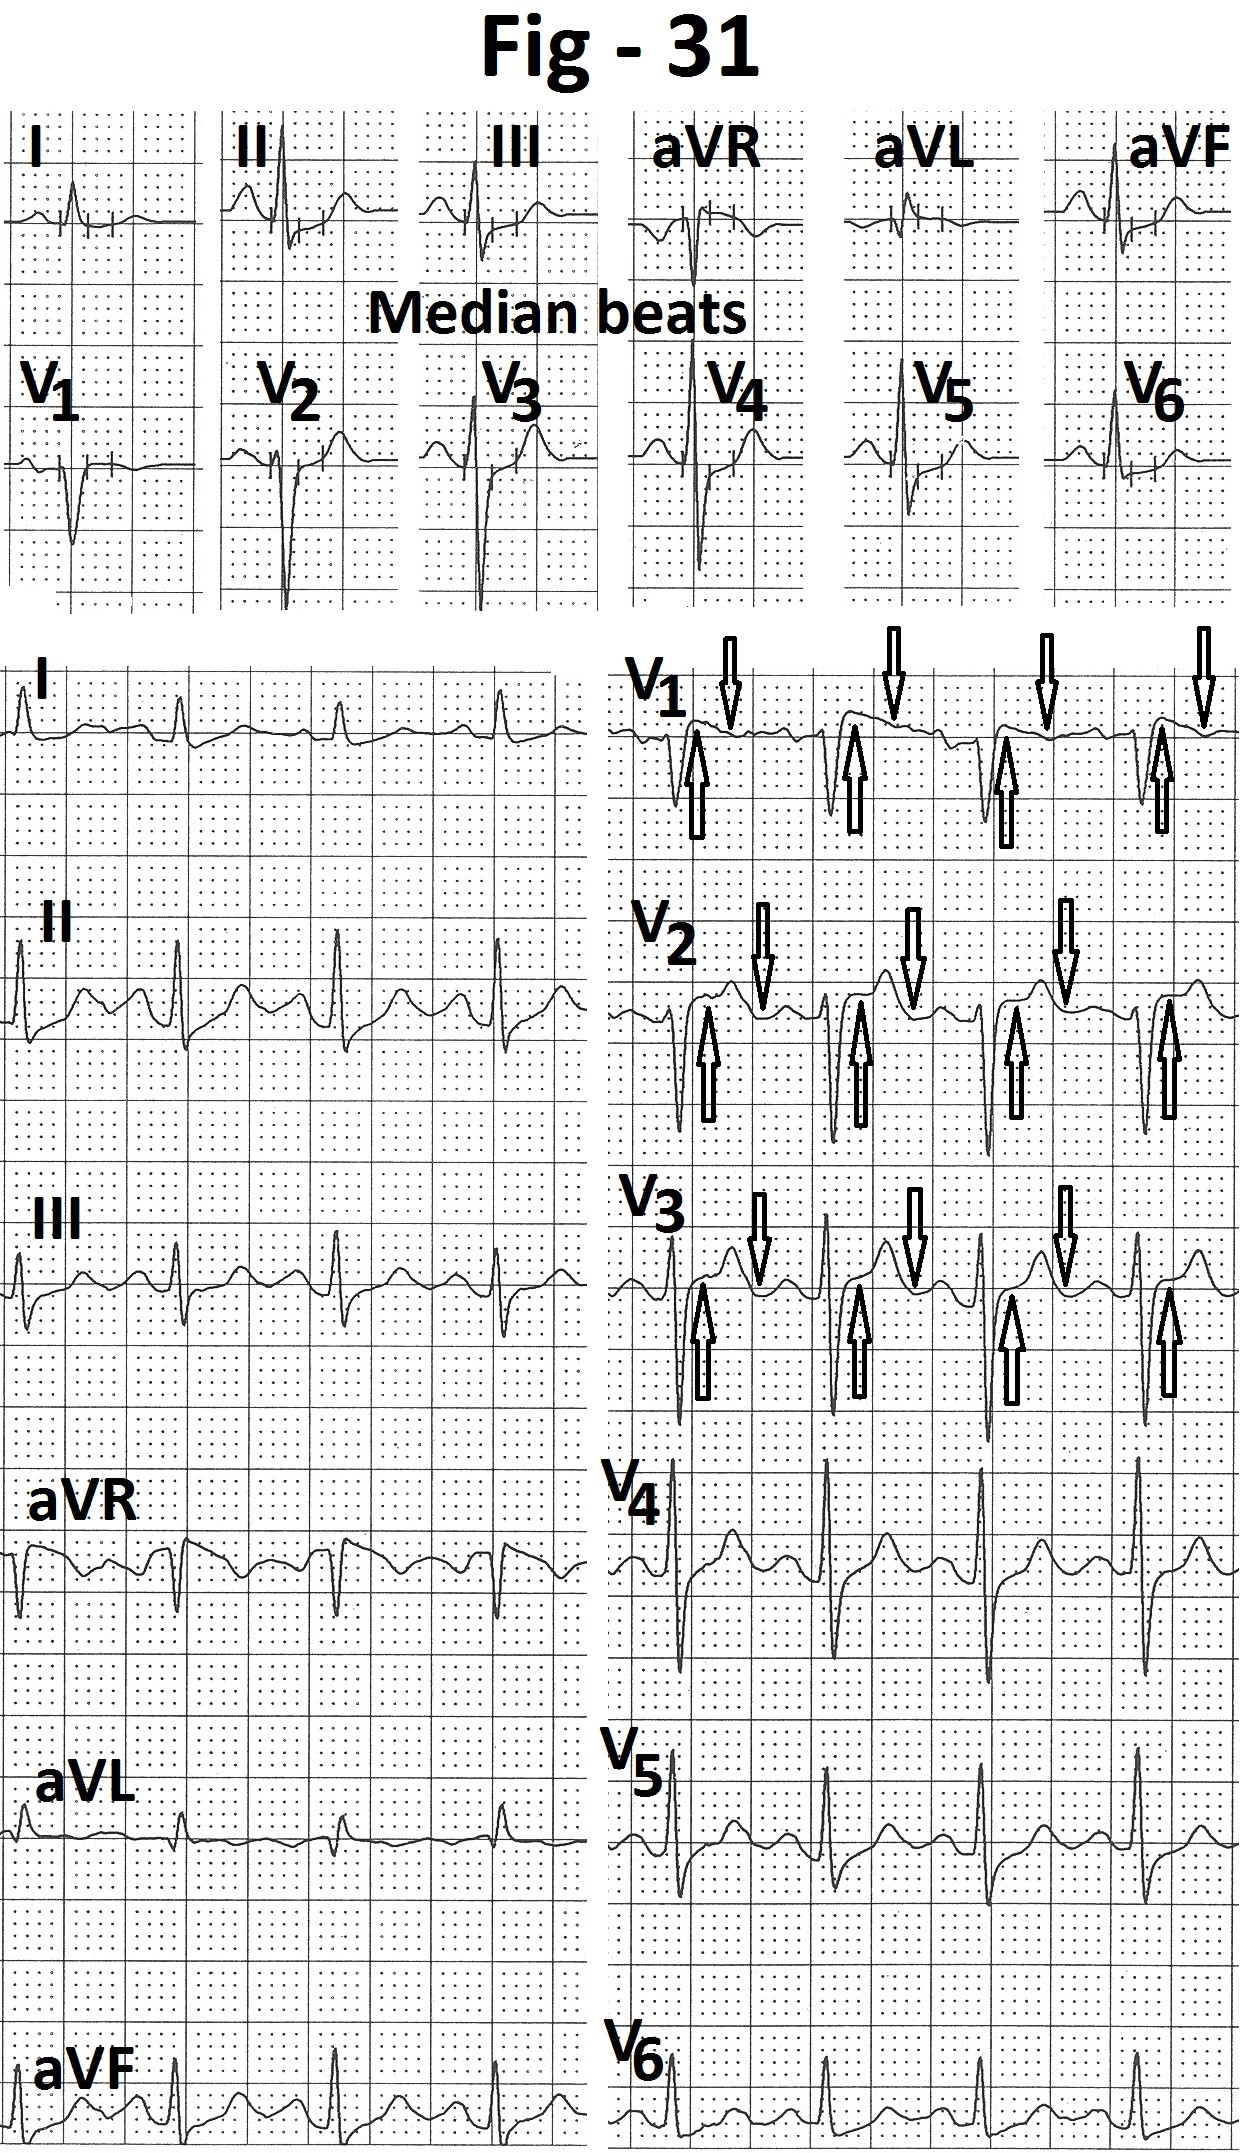
Figure 31: Electrocardiogram recorded during first minute of recovery showing elevation of ST segment (marked) and negative deflection of terminal part of T wave (marked ) in leads V1 to V3. Median beats are normal.

Figure 32: Apical four chamber views at end-diastole (a) and at end-systole (b) showing normal regional wall motions and mild prolapse of mitral valve (P). LA- left atrium, LV- left ventricle, RA - right atrium, RV- right ventricle.

Figure 33: Short axis views (a) at end-diastole and (b) at end-systole showing normal regional wall motions. LV- left ventricle.
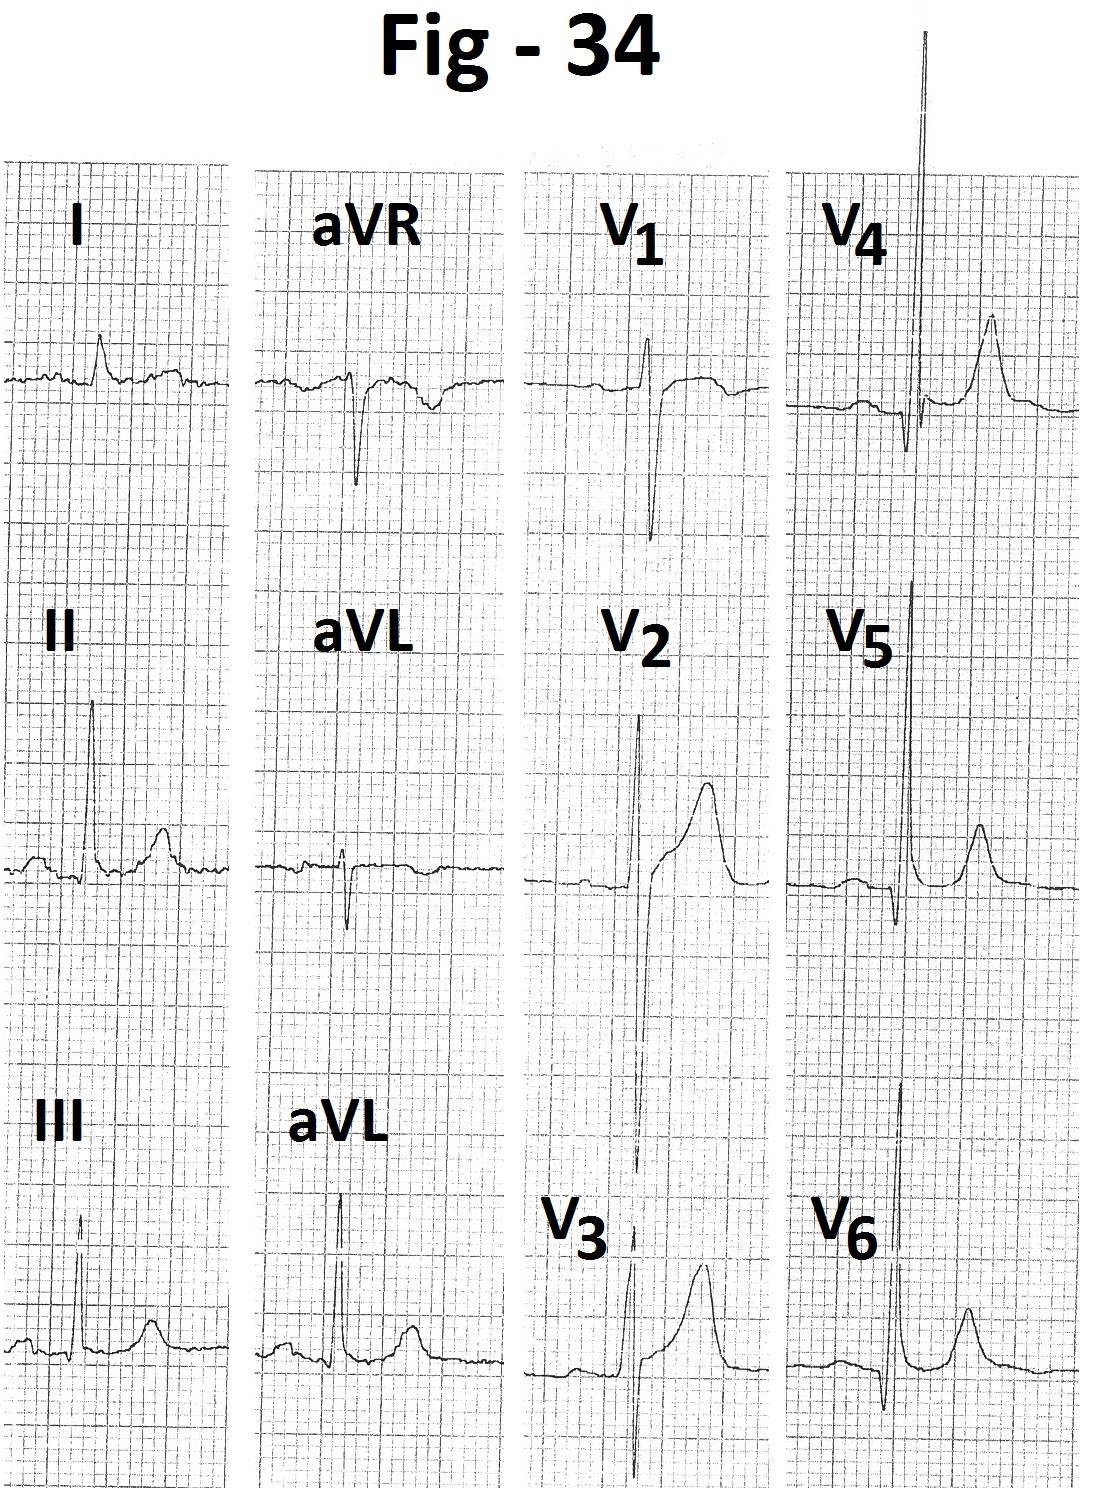
Figure 34: Electrocardiogram showing “early repolarization pattern”.
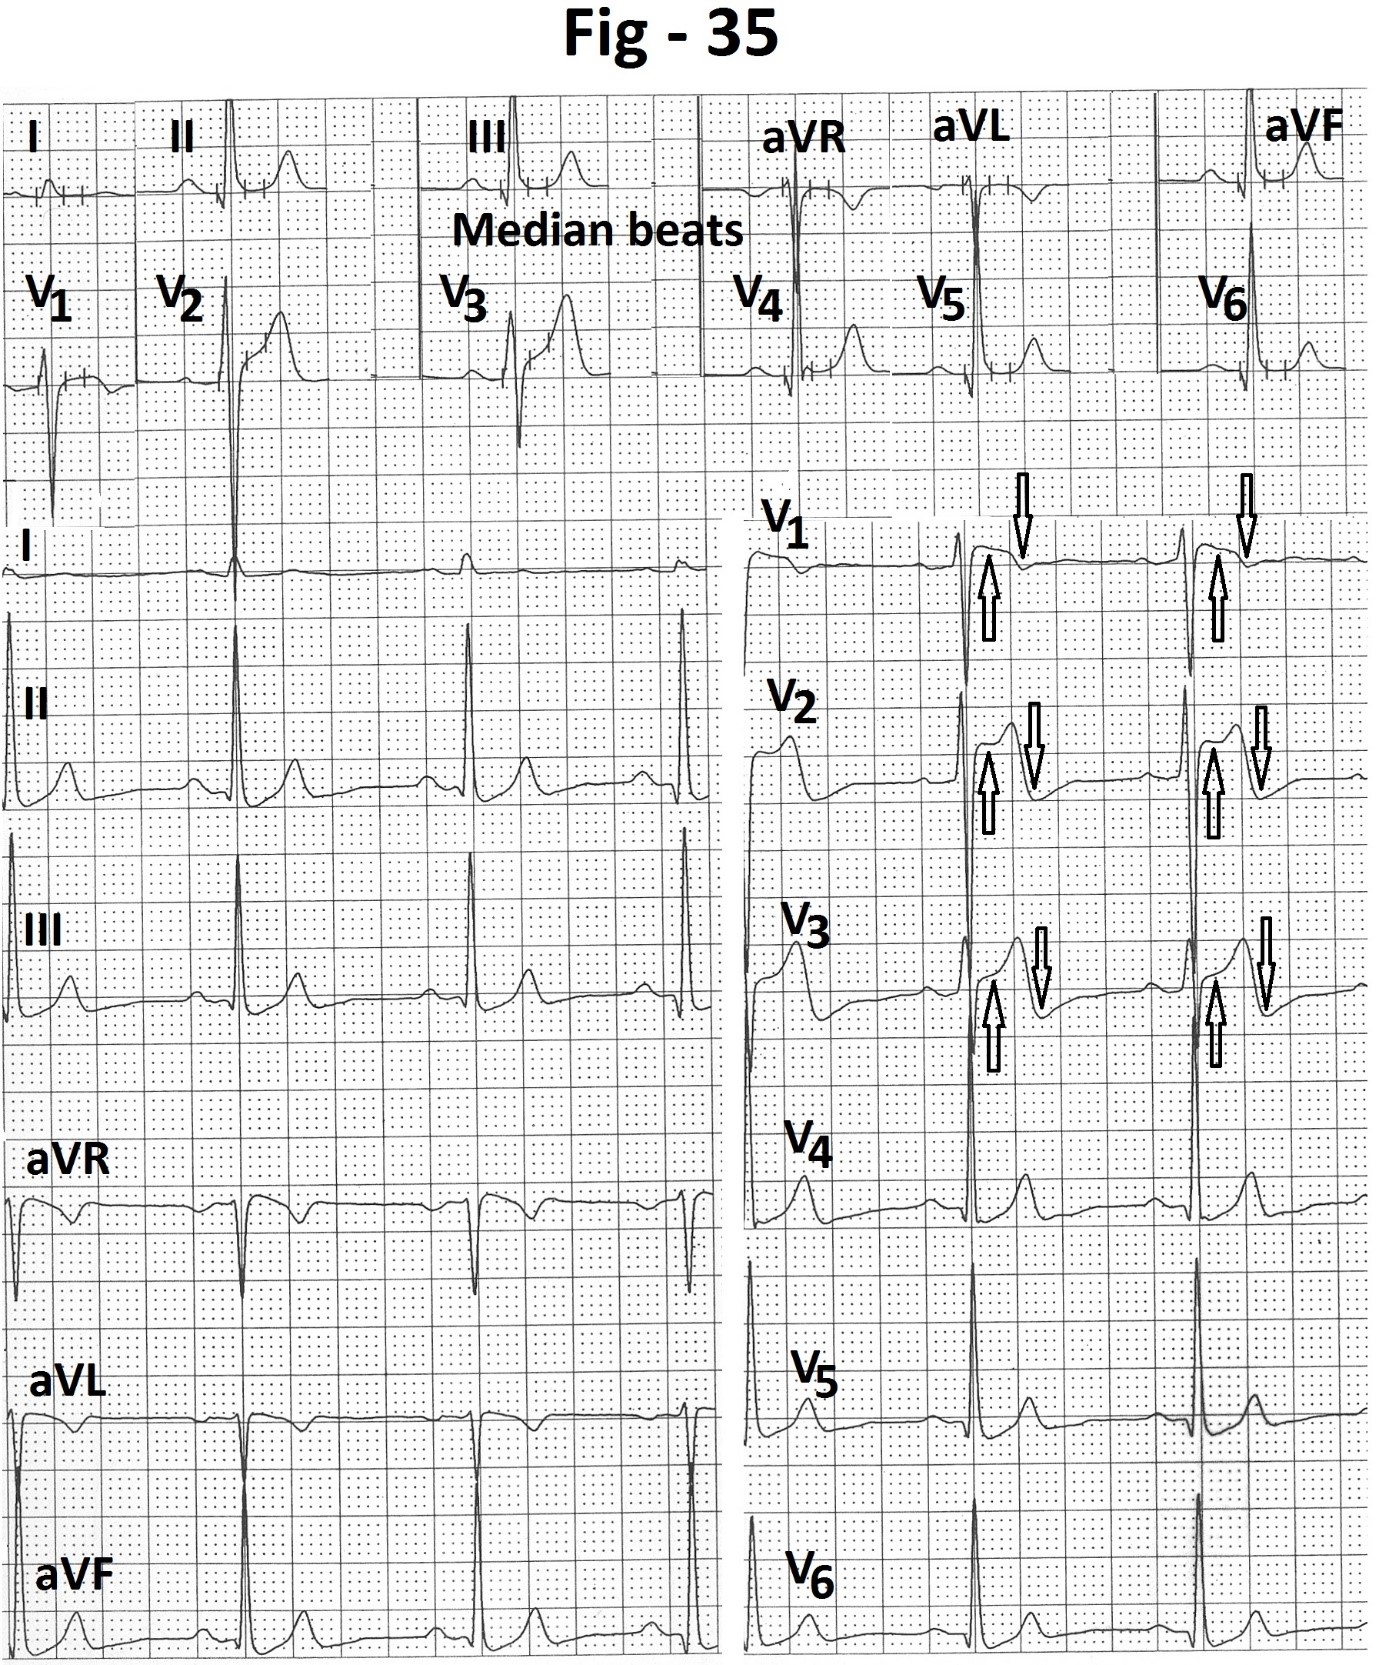
Figure 35: Supine electrocardiogram during treadmill test showing ST segment elevation (marked) and negative terminal deflection of T wave (marked) in leads V1 to V3. Median beats printed at the same time, in the upper part of Figure, do not show any abnormality in leads V1 to V3.

Figure 36: Electrocardiogram recorded at peak exercise showing persistence of ST segment elevation (marked) terminal negative deflection of and T wave (marked) in leads V1 to V3. Simultaneously printed median beats in the upper part of Figure are normal.

Figure 37: Electrocardiogram recorded at end of fifth minute of recovery showing persistence of ST segment elevation (marked) and terminal negative deflection of T wave (marked) in leads V1 to V3. Simultaneously printed median beats in the upper part of Figure are normal.
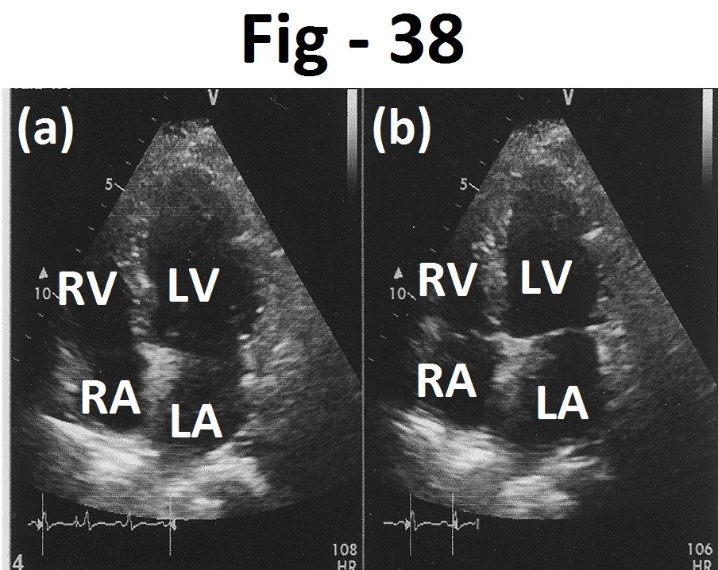
Figure 38: Apical four chamber views recorded at end-diastole (a) and at end- systole (b) showing normal wall motion. LA- left atrium, LV- left ventricle, RA - right atrium, RV- right ventricle.
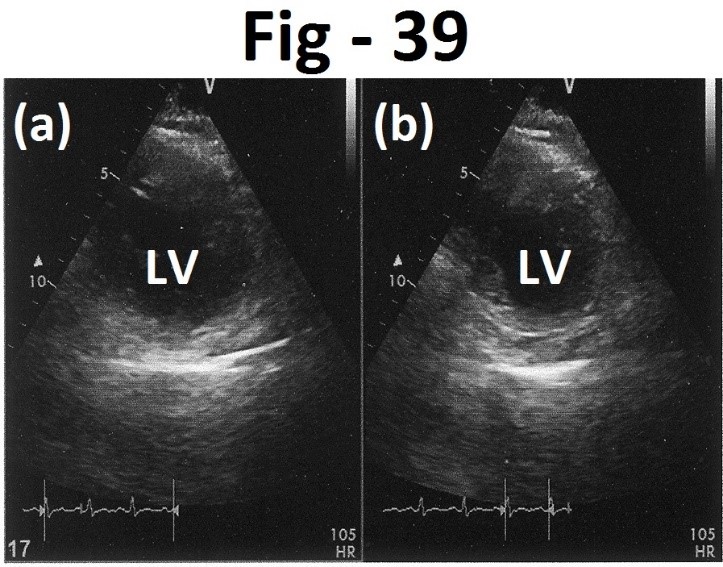
Figure 39: Short axis views recorded at end-diastole (a) and at end-systole (b) showing normal wall motion. LV left ventricle.

Figure 40: Electrocardiogram in supine position during treadmill stress test showing ST segment elevation (marked) and negative deflection of terminal part of T wave (marked) in leads V1 to V3. Simultaneously printed median beats in upper part of the Figure are normal.

Figure 41: Electrocardiogram recorded at peak exercise shows persistence of ST segment elevation (marked) and terminal negative deflection of T wave (marked ) in leads V1 to V3 . Simultaneously printed median beats do not show any abnormality.

Figure 42: Electrocardiogram recorded at the end of seventh minute of recovery showing persistence of ST segment elevation (marked) and negative terminal deflection of T wave (marked) in leads V1 to V3. Simultaneously printed median beats are normal.

Figure 43: Diagram showing genesis of ST segment and negative terminal deflection of T wave due to underdamping of stylus. A- Overshoot of ascending limb of S wave, B- overshoot of descending limb of T wave.
Case-5
A 50 years old asymptomatic male presented for cardiac evaluation for abnormal electrocardiogram. He had no cardiac symptoms and no cardiovascular risk factors. Echocardiography revealed mild prolapse of anterior mitral leaflet with mild mitral regurgitation. Aortic valve showed mild sclerosis with mild aortic regurgitation without any stenosis. There was mild concentric hypertrophy of the left ventricle. Left atrium was mildly enlarged. There was no regional wall motion abnormality. (Figure 32 and 33). Electrocardiogram recorded just before treadmill test (Figure 34) showed, “early repolarization” pattern with small narrow q waves, tall R waves, mild ST segment elevation with concavity upward and positive T waves in leads II, III, aVF and leads V4 to V6. Resting pulse rate was 63 beats/minute. Resting blood pressure was 120/80 mm Hg. Patient could exercise for 12:30 minutes (13.7 METs). There were no symptoms. Peak heart rate was 150 beats/minute (88% of the age predicted maximal heart rate). Peak blood pressure was 180/80 mm Hg. Heart rate recovery was normal. During treadmill testing, supine electrocardiogram at rest showed ST segment elevation (marked ) with negative terminal deflection of the T wave (marked ) in leads V1 to V3 (Figure 35). Once again, simultaneously printed median beats did not show any abnormality in leads V1 to V3. ST segment and T wave changes persisted during exercise (Figure 36) and recovery (Figure 37). Simultaneously recorded median beats did not show any abnormality in leads V1 to V3.
Case-6
A 38 years old asymptomatic male with diastolic hypertension presented for cardiac evaluation. On echocardiography, there was no wall motion abnormality (Figure 38 and 39). Resting heart rate was 105 beats/ minute. Resting blood pressure was 140/100 mm Hg. Supine electrocardiogram (Figure 40) showed ST segment elevation (marked) and negative terminal deflection of the T waves (marked) in leads V1 to V3. Simultaneously printed median beats did not show any abnormality in leads V1 to V3. Patient could exercise for 9:15 minutes (10.5 METs). Peak heart rate was 178 beats/minute (98% of the age predicted maximal heart rate). Peak blood pressure was 200/100 mm Hg. Patient had no symptoms. ST segment elevation and negative deflection of terminal part of the T waves persisted during exercise (Figure 41) and recovery (Figure 42). Heart rate recovery was normal.
Discussion
(1) Differential diagnosis
(a) ST segment elevation in leadsV1 to V3
(i) Normal variant
Points in favour:
- No evidence of any other cause of ST segment elevation.
- ST segment elevation of up to 0.25 mV at rest [1-3].
- ST segment elevation greatest in lead V2.
- No symptoms during exercise
- No change during exercise.
- Normal chronotropic response, normal blood pressure response and normal heart rate recovery.
Points against
- In normal variant, ST segment elevation is usually rapid upsloping [3]. In our cases, ST segment had saddle back configuration. However, some normal persons can also have ‘saddle’ type ST segment elevation in leads V1 to V3 [4].
- In normal variant, the T waves are positive in leads V1 to V3. In our cases, there was negative deflection of the terminal part of the T waves.
- ‘Median beats’ printed simultaneously in the upper part of the page did not have any ST segment or T wave abnormality in leads V1 to V3.
- There was no ST segment elevation or negative terminal deflection of the T waves in the ECG recorded from another machine.
(ii) “Early repolarization” variant
Points in favour
- ‘Early repolarization’ variant can also produce ST segment elevation in leads V2 and V3.
Points against
-‘Early repolarization’ pattern is seen mostly in young person’s [1]. Five of our six cases were above 40 years.
- In ‘early repolarization’ variant, the ST segment elevation is most marked in mid and lateral precordial leads (leads V3 to V6), being most marked in lead V4. 3,4 In all of our cases, changes were localized to right precordial leads ( leads V1 to V3).
- In ‘early repolarization’ variant, the ST segment elevation is rapid up sloping [3] with upward concavity [4]. In all of our cases, ST segment elevation had ‘saddle’ configuration.
- In ‘early repolarization’ variant, the T waves are positive in leads with ST segment elevation [5]. All of our cases had negative terminal deflection of the T waves.
- In ‘early repolarization’ variant, the ST segment elevation normalizes during exercise [4-6]. In all of our cases, ST segment elevation in leads V1 to V3 did not normalize during exercise.
- ‘Median’ beats printed simultaneously in the upper part of the page did not show any abnormality in the ST segment or the T waves in leads V1 to V3.
- Electrocardiogram recorded from another machine just before or immediately after treadmill test did not show any abnormality in leads V1 to V3.
(iii) Athlete’s heart
Point in favour
- Athletes can have ST segment elevation similar to ‘early repolarization’ in leads V1 to V3 [5-7]. Some athletes have “domed” ST segment elevation combined with inverted T waves in leads V1 to V4 [8,9].
Point against
- None of our patients was an athlete or hard manual worker.
- In our cases ST segment elevation was most prominent in lead V1 in contrast to athletes who have most prominent changes in anterior precordial leads [10].
- Our cases had negative deflection of the terminal part of the T wave. No such change occurs in athletes.
- Athletes usually have sinus bradycardia and/or isolated QRS voltage criteria for left ventricular hypertrophy [4,7,11,12]. None of our patients had these findings.
- ST segment and T wave abnormalities in athletes lessen or disappear during exercise [6]. In our cases, ST segment and T wave changes persisted during exercise and recovery.
- ‘Median’ beats printed simultaneously in the upper part of the page did not show any abnormality in the ST segment or the T waves in leads V1 to V3.
- Electrocardiogram recorded from another machine, just before or immediately after treadmill test, did not show any abnormality in leads V1 to V3.
(iv) Transmural septal ischemia
Points in favour
- ST segment elevation in leads V1 to V3 can occur if there is critical stenosis of the major septal branch of left anterior descending coronary artery [3,4].
Points against
- Absence of history of angina or equivalent symptoms at rest or on effort [1].
- Absence of ST segment elevation in lead aVR [1,4].
- Absence of reciprocal ST segment depression [1,3,4].
- Absence of preceding taller, symmetrically peaked and wider T waves [4,13,14].
- Absence of prolongation of QT interval [4].
- In transmural ischemia the ST segment elevation is concave upwards [4]. In our cases the ST segment elevation had “saddle” configuration.
- Simultaneously printed ‘median’ beats did not show any abnormality in leads V1 to V3.
- ECG recorded from another machine, just before or immediately after treadmill testing, did not show any abnormality in leads V1 to V3.
(v) Spasm in left anterior descending coronary artery (Prinzmetal’s angina or variant angina)
Points against
- No history of chest discomfort before, during or after treadmill test.
- Coronary vasospasm is transient and resolves in minutes [3]. In our cases electrocardiographic changes persisted throughout the stress test.
- In coronary vasospasm ST segment elevation is usually pronounced with concavity upward and tall, upright and wide T waves [15]. Our cases had ST segment elevation of 1 to 3 mm. T waves were not tall and wide. On the contrary, there was negative deflection of terminal part of the T waves.
- Simultaneously printed ‘median’ beats did not show any ST -T abnormality in leads V1 to V3.
(vi) Takotsubo syndrome
Point in favour
- ST segment elevation in leads V1 to V3 can occur in Takotsubo syndrome.
Points against
- In Takotsubo syndrome, there is typical severe chest discomfort. All of our patients were asymptomatic and did not have any chest discomfort during or after stress test.
- In Takotsubo syndrome, ST segment elevation is substantial and often diffuse [16]. Our cases had only mild ST segment elevation.
- In Takotsubo syndrome, electrocardiographic changes resemble those of transmural infarction. Our cases had ‘saddle’ shaped ST segment elevation with negative deflection of the terminal part of the T waves.
- Simultaneously printed ‘median’ beats did not show any ST segment of the T waves changes.
- Electrocardiogram recorded from another machine just before or immediately after treadmill test, did not show any abnormality
(vii) Acute submassive/massive pulmonary embolism
Point in favour
- Acute submassive or massive pulmonary embolism may be associated with ST segment elevation in leads V1 to V3 [17-19].
Points against
- All of our patients were asymptomatic.
- None of our patients had sinus tachycardia incomplete or complete right bundle branch block, right axis deviation in limb leads or clockwise rotation in precordial leads. These are common electrocardiographic findings in acute pulmonary embolism [20].
- ST segment elevation is usually coved in pulmonary embolism [17].None of our patients had coved ST segment elevation.
- Submassive/massive pulmonary embolism is associated with T wave inversions in leads V1 to V3 [21]. Our patients had positive T waves in these leads.
- Simultaneously printed ‘median’ beats did not show any abnormality in leads V1 to V3 in any of our cases.
- ECG recorded from another machine, just before or soon after treadmill test, did not show any abnormality in leads V1 to V3.
(viii) Brugada syndrome
Brugada syndrome type 1
Points in favour
- ST segment elevation in leads V1 to V3 [22,23].
- ST segment elevation can be transient [23].
Points against
- Brugada syndrome type 1 is usually associated with incomplete or complete right bundle branch block [3,22,23,25]. None of our patients had this finding.
- In Brugada syndrome type 1, ST segment is coved and down sloping [11,22,23,25]. Our cases had ‘saddle’ shaped of ST segment elevation which was not down sloping.
- In Brugada syndrome type 1, the T waves are negative in leads V1 to V3 [23,25,26]. All of our cases had positive T waves with negative deflection of only the terminal part.
- Augmentation of the ST segment elevation early in recovery after exercise is considered specific of Brugada syndrome [27]. None of our cases showed this finding.
- History of syncope of probable arrhythmic origin or documented VT/VF or family history of sudden cardiac death before the age of 45 years are considered necessary for diagnosis of Brugada syndrome in patients without classical ECG [23]. None of our patients had such history.
- Simultaneously printed ‘median’ beats did not show any abnormality in leads V1 to V3.
Brugada syndrome type 2
Points in favour
- ST segment elevation in leads V1 and V2 [22,23].
- ‘Saddle’ type ST segment elevation [23].
- Biphasic T waves [23].
- Transient nature of ST segment elevation [23].
Points against
- In Brugada syndrome, T waves are inverted in leads V1 to V3. All of our cases had positive T waves.
- Simultaneously printed median beats did not show any abnormality in leads V1 to V3.
- There was no history of syncope or documented VT/VF or family history of premature sudden cardiac death. Such history is considered necessary in absence of Brugadatype 1 pattern at rest or on provocation by a class 1 antarrhythmic drug [23].
- It is difficult to believe that six consecutive patients from different families had Brugada syndrome type 2.
(ix) Secondary ST - T changes
When ST segment or T wave changes occur secondary to abnormalities of QRS, these are called secondary [4]. Secondary ST segment elevation in leads V1 to V3 are seen in left ventricular hypertrophy (strain pattern) [28,29] or left bundle branch block [3,30,31]. None of our patients had such QRS abnormalities.
(b) Biphasic T waves in leads V1 to V3
Biphasic T waves are described in following conditions -
(i) Recovery phase of acute transmural infarction
During recovery phase of acute transmural infarction, terminal part of the T wave is the first to become inverted [32]. During this phase T wave is biphasic.
(ii) Athletes
Athletes can have biphasic T waves with ST segment elevation [3,4]. These changes are usually associated with sinus bradycardia, ST segment elevation in leads V3 to V6 and increased QRS voltage.
(iii) Brugada syndrome - Type 2
These patients can have biphasic T waves in leads V1 and V2 [23].
Points against
- None of our patients had above mentioned conditions.
- Simultaneously printed ‘median’ beats did not show any T wave abnormality.
- ECG recorded from another machine just before or immediately after treadmill test, did not have any T wave abnormality.
(c) Possibility of mechanical artefact
Point in favour
(i) None of our cases had history suggestive of any organic cause.
(ii) No patient had any regional wall motion abnormality on echocardiography.
(iii) In all cases, the ST segment elevation was localized to leads V1 to V3 with maximal elevation in lead V2.
(iv) ST segment elevation had ‘saddle’ configuration. It was not upsloping, coved or concave upward in any case.
(v) There were no reciprocal ST segment depressions in any lead.
(vi) None of the patients had ST segment elevation in lead aVR.
(vii) Patients could complete treadmill test without any symtoms.
(viii) There was no change in leads V1 to V3 or lead aVR during exercise or recovery.
(ix) There were no ST segment depressions during exercise or recovery.
(x) All cases had similar negative deflection of the terminal part of the T waves.
(xi) Chronotropic response, blood pressure response and heart rate recovery were normal in all cases.
(xii) ST segment elevation and terminal negative deflection of the T waves were observed in six consecutive tests performed on the same stress test machine.
(xiii) ‘Median’ beats printed simultaneously from another styli, in the upper part of the same page, did not show any ST segment or T wave abnormality throughout stress and recovery.
(xiv) Electrocardiogram recorded from another machine, just before or soon after the stress testing, did not show any abnormalities in leads V1 to V3.
All these points made us feel that the abnormalities localized to leads V1 to V3 in all of our cases were related to the styli of these leads in the printer of the particular machine.
(d) Possible explanation for pseudo ST segment elevation and negative terminal deflection of T wave localized to leads V1 to V3.
A mechanical problem in the printer is known to affect the ST segment in the printed electrocardiogram [33]. We felt that the ST segment elevation and negative terminal deflection of the T wave localized to leads V1 to V3 were due to fault in “damping” of the styli of the leads V1,V2 and V3 in the particular printer. When the stylus is too loose or not pressed firmly enough against the electrocardiograph paper, it is called ‘underdamping’ [34]. On the other end, when the writing stylus is pressed too firmly against the electrocardiograph paper, it is called ‘overdamping’ [34].
We feel that the problem in the printer of our treadmill stress test system was one of ‘underdamping’ of the styli of leads V1,V2 and V3. Underdamping results in increased excursion (overshooting) of the stylus [34]. In our case it resulted in increased upward excursion of the styli at the end of the S wave. It resulted in elevation of the ‘j’ point (Figure 43). This formed initial hump of the ‘saddle’. Meanwhile the upstroke of the T wave started. Before the stylus could return back to the isoelectric line, it again went up inscribing the terminal part of the upstroke of the T wave. This resulted in elevation of the ST segment (Figure 43). The peak of the T wave formed the second peak of ‘saddle’ (Fig 43). After inscribing the top of the T wave the stylus moved down and printed the downslope of the T wave. While coming down, the stylus again overshot in a downward direction before coming back to the baseline. (Figure 43) This resulted in negative terminal deflection of the T wave.
Conclusion
‘Underdamping’ of the stylus of the printer of the treadmill stress test system can result in pseudo elevation of the ST segment and pseudo negative deflection of the terminal part of the T waves in the affected leads. Absence of symptoms of myocardial ischemia during stress and recovery should raise suspicion of such possibility. Absence of any increase in the electrocardiographic abnormalities on the continuation of exercise, absence of abnormalities in simultaneously printed median beats and in any electrocardiogram recorded from another machine confirm this possibility.
References
1. Thomas GS, Samtani SR, Ellested MH. 2018. Interpretation of the ECG during exercise and recovery. In: Thomas GS, Wann LS, Ellested MH (eds) Ellestad’s Stress Testing. Oxford, New Delhi. 160-198.
2. Fox S, Naughton JP, Haskell WL. 1971. Physical activity and the prevention of coronary heart disease. Ann Clin Res. 3: 404- 432. Ref.: https://pubmed.ncbi.nlm.nih.gov/4945367/
3. Mirvis DM, Goldberger AL. 2019. Electrocardiography. In: Zipes DP, Libby P, Bonow RO, Mann DL, Tomaselli GF (eds) Braunwald’s Heart Disease. Elsevier. 117-151.
4. De Luna AB, Goldwasser D, Fiol M. 2017. Surface electrocardiography. In: Fuster V, Harrington RA, Narula J, Eapen Z (eds) Hurst’s The Heart. Mc Graw Hill. 317.
5. Thomas GS, Ellestad MH. 2018. Sports medicine and cardiac rehabilitation for coronary and peripheral artery disease patient. In: Thomas GS, Wann LS, Ellestad MH (eds) Ellested’s Stress Testing. Oxford, New Delhi. 495-516.
6. Goldman MJ. 1953. RS-T segment elevation in mid and left percordial leads as a normal variant. Am Heart J. 46: 817-820. Ref.: https://pubmed.ncbi.nlm.nih.gov/13104323/ DOI: https://doi.org/10.1016/0002- 8703(53)90080-5
7. Drezner JA, Fischbach P, Froelicher V. 2013. Normal electrocardiographic findings: recognising physiologic adaptations in athletes. Brit J Sports Med. 47: 125-136. Ref.: https://pubmed.ncbi.nlm.nih.gov/23303759/ DOI: https://doi.org/10.1136/bjsports-2012- 092068
8. Drezner JA, Ackerman MJ, Anderson J. 2013. Electrocardiographic interpretation in athletes: the “Seattle criteria”. Brit J Sports Med. 47: 122-129. Ref.: https://pubmed.ncbi.nlm.nih.gov/23303758/ DOI: https://doi.org/10.1136/bjsports-2012- 092067
9. Corrado D, Pelliccia A, Hoidbuchel H. 2010. Recommendations for interpretation of 12- lead electrocardiogram in the athlete. Eur Heart J. 31: 243-259. Ref.: https://pubmed.ncbi.nlm.nih.gov/19933514/ DOI: https://doi.org/10.1093/eurheartj/ehp473
10. Muramoto D, Singh N, Aggarwal S. 2015. Spectrum of ST amplitude: Athletes and an ambulatory clinical population. J Electrocardiol. 46: 427. Ref.: https://pubmed.ncbi.nlm.nih.gov/23866295/ DOI: https://doi.org/10.1016/j.jelectrocard.2013.06. 009
11. Thompson PD, Baggish AL. 2019. Exercise and sports cardiology. In Zipes DP, Libby P, Bonow RO, Mann DL, Tomaselli GF (eds) Braunwald’s Heart Disease. 1038-1045.
12. Mark Eetes NA, Link MS, Maron BJ. 2017. The athlete and cardiovascular system. In Fuster V, Harrington RA, Narula J, Eapen Z (eds) Hurst’s The Heart. 1561-1570.
13. Lee JH, Crump R, Ellestad MH. 1995. Significance of precordial T wave increase during treadmill stress testing. Am J Cardiol. 76: 1278-1299. Ref.: https://pubmed.ncbi.nlm.nih.gov/7503013/ DOI: https://doi.org/10.1016/s0002- 9149(99)80359-2
14. Mananki MF, Wang T, Bhat PK. 2011. Transient peaked T waves during exercise stress testing: an unusual manifestation of reversible cardiac ischemia. J Electrocardiol. 44: 23-26. Ref.: https://pubmed.ncbi.nlm.nih.gov/20719336/ DOI: https://doi.org/10.1016/j.jelectrocard.2010.07. 002
15. Schamroth L. 1982. Coronary insufficiency. In: Schamroth C (ed). An introduction to electrocardiography. Blackwell Science. 157- 185.
16. Scirica BM, Libby P, Morrow DA. 2019. ST elevation myocardial infarction: Pathophysiology and clinical evaluation. In: Zipes DP, Libby P, Bonow RO, Mann DL, Tomaselli GF (eds). Braunwald’s Heart Disease. 1095-1122.
17. Schamroth L. 1988. Acute pulmonary embolism. In: Schamroth C (ed). An introduction to electrocardiography. Blackwell Science. 227-232.
18. Wagner GS, Wang TY. 2008. Miscellaneous conditions. In: Wagner GS (ed). Marriott’s Practical Electrocardiography. Wolters Kluwer. 209-235.
19. Ozer N, Yorgun H, Canpolet U. 2011. Pulmonary embolism presenting with evolving electrocardiographic abnormalities mimicking anteroseptal myocardial infarction: A case report. Med Princ Pract. 20: 577-580. Ref.: https://pubmed.ncbi.nlm.nih.gov/21986020/ DOI: https://doi.org/10.1159/000330030
20. Fernandez JR, Tapson V, Fuster V. 2017. Pulmonary embolism. In: Fuster V, Harrington RA, Narula J, Eapen Z (eds). Hurst’s The Heart. Mc Graw Hill. 1809-1834.
21. Ferrari E, Embert A, Chevalier T. 1997. The ECG in pulmonary embolism. Predictive valve of negative T waves in precordial leads - 80 case reports. Chest. 111: 537-543. Ref.: https://pubmed.ncbi.nlm.nih.gov/9118684/ DOI: https://doi.org/10.1378/chest.111.3.537
22. Priori SG, Napolitano C. 2017. Geneties of channelopathies and clinical implications. In Fuster V, Harrington RA, Narula J, Eapen Z (eds). Hurst’s The Heart. 1910-1922.
23. Olgin JE, Tomaselli GF, Zipes DP. 2019. Ventricular arrhythmias. In: Zipes DP, Libby P, Bonow RO, Mann DL, Tomaselli GF (eds). Brawnwald’s Heart Disease. 753-771.
24. Tomaselli GF, Rubart M, Zipes DP. 2019. Mechanism of cardiac arrhythmias. In: Zipes DP, Libby P, Bonnow RO, Mann DL, Tomaselli GF (eds). Braunwald’s Heart Disease. 619-647.
25. Tester DJ, Ackerman MJ. 2019. Geneties of cardiac arrhythmias. In: Zipes DP, Libby P, Bonow RO, Mann DL, Tomaselli GF (eds). Braunwald’s Heart Disease. 604-618.
26. Arbastini EA, Favalli V, Narula N. 2017. Genetic basis of cardiovascular disease. In: Fuster V, Harrington RA, Narula J, Eapen Z (eds). Hurst’s The Heart. 174-204.
27. Makimoto H, Nokagowa E, Tokaki H. 2010. Augmented ST segment elevation during recovery from exercise predicts cardiac events in patients with Brugada syndrome. J Am Coll Cardiol. 56: 1576-1584. Ref.: https://pubmed.ncbi.nlm.nih.gov/21029874/ DOI: https://doi.org/10.1016/j.jacc.2010.06.033
28. Schamroth L. 1982. Left ventricular hypertrophy. In: Schamroth C (ed). An introduction to Electrocardiography. Blackwell Science. 67-77.
29. Mittal SR. 2016. Left ventricular systolic overload. Cardiology Today. 20: 101-109.
30. Schamroth L. 1982. Left bundle branch block. In Schamroth C (ed). An introduction to Electrocardiography. Blackwell Science. 99- 104.
31. Mittal SR. 2016. Left ventricular depolarization delay. Cardiology Today. 20: 101-109.
32. Wagner GS, Lim TH. 2008. Myocardial infarction. In: Wagner GS (ed). Marriott’s Practical Electrocardiography. Wolters Kluwer. 179-207.
33. Mittal SR. 2021. Transient pseudo ST segment alternans during treadmill test a mechanical artefact. Cardiology Today. 25: 32-35.
34. Schamroth L. 1982. Basic principles. In Schamroth C (ed). An introduction to Electrocardiography. Blackwell Science. 5-33.