
-
Mail us:
editor@raftpubs.org
Indexing & Abstracting
Full Text
Research ArticleDOI Number : 10.36811/jcshd.2022.110027Article Views : 0Article Downloads : 0
Status of exercise duration and metabolic equivalents in interpretation of exercise electrocardiography testing
SR Mittal1* and Govind Mittal2
1Department of Cardiology, Mittal Hospital & Research Centre, Pushkar Road, Ajmer (Raj.), Pune, 305001
2Gokhale Institute of Polytical Sciences and Economics, Pune
*Corresponding Author: SR Mittal, Department of Cardiology, Mittal Hospital & Research Centre, Pushkar Road, Ajmer (Raj.), Pune, 305001, Email: drsrmittal@gmail.com
Article Information
Aritcle Type: Research Article
Citation: SR Mittal, Govind Mittal. 2022. Status of exercise duration and metabolic equivalents in interpretation of exercise electrocardiography testing. J Cardiovasc Surg Heart Dis. 4: 57-67.
Copyright: This is an open-access article distributed under the terms of the Creative Commons Attribution License, which permits unrestricted use, distribution, and reproduction in any medium, provided the original author and source are credited. Copyright © 2022; SR Mittal
Publication history:
Received date: 16 March, 2022Accepted date: 01 April, 2022
Published date: 06 April, 2022
Abstract
Both exercise duration and metabolic equivalent give an idea about the effort tolerance of the patient. Effort tolerance depends on several factors e.g. cardiac status, pulmonary status, neuromuscular status, psychological status, physical conditioning, age, sex, haemoglobin concentration etc. Therefore, diminished effort tolerance alone, in absence of other evidence, can not be taken as an indication of the presence or severity of coronary artery disease or left ventricular dysfunction. Regression equations used for calculation of metabolic equivalent (MET) include speed and inclination of the treadmill (stage of particular protocol) in addition to the duration of exercise. MET, therefore, gives a more correct impression about the workload achieved by a given patient. For the same reason, MET is useful for comparing the reports of different treadmill tests performed by different protocols at different times. It helps in assessing the progression of the disease. Regression equations used by most of the conventional treadmill systems do not include other factors that affect effort tolerance. These include the age, sex, and weight of the patient. This is an important limitation.
Keywords: Coronary Artery Disease; Exercise Electrocardiography; Left Ventricular Function; Myocardial Ischemia; Metabolic Equivalent; Treadmill Test
Duration of exercise
It reflects the functional capacity of the patient.
(a) Factors affecting exercise duration: Exercise duration depends on several factors including physical conditioning, level of exercise training, comorbidities (e.g. respiratory insufficiency, neuromuscular disease, anaemia), left ventricular functions at rest or during exercise, psychological status of patient (e.g. anxiety, fear of walking an a moving platform, depression) and environmental conditions in the exercising laboratory [1,2].
(b) Clinical significance of exercise duration: Exercise duration, in general, is a good predictor of overall prognosis [3,4,5]. However, there are some limitations. Firstly, it does not hold true if there is evidence of significant myocardial ischemia by any other criteria e.g. more than 2 mm of ST-segment depression during a treadmill test [6]. Such patients are likely to have a poor prognosis even if exercise duration is reasonable at the time of treadmill testing. This disparity occurs because even after reaching maximum capacity, cardiac patients may use anaerobic metabolism to continue exercising [7]. Secondly, it is a weaker predictor of death in elderly individuals than in younger individuals when stress testing [8] is performed at an older age, and therefore, be considered a negative prognostic factor. Thirdly, exercise duration depends on the workload. Workload varies depending upon the protocol used for the treadmill test. Therefore patients may have differences in the duration of exercise in spite of similar disability, depending on the type of protocol.
Decreased exercise duration alone, in the absence of other evidence, can not be taken as a criteria to diagnose the presence of coronary artery disease or myocardial ischemia. This is because of the fact that exercise duration is affected by several factors other than myocardial ischemia. The presence of other evidence of myocardial ischemia, decreased duration of exercise may correlate with the severity of myocardial ischemia, left ventricular dysfunction at rest or during exercise. Decreased duration of exercise can suggest a greater degree of myocardial ischemia than that assessed by electrocardiographic criteria alone. In the case of documented coronary artery disease, decreased duration of exercise may correlate with an adverse prognosis.
Metabolic Equivalent (MET)
The MET is also a measure of exercise capacity or workload during exercise. It represents the maximum oxygen consumption at a given time during an exercise test [9]. One MET is equal to the resting metabolic rate which is equal to 0.5 ml of oxygen consumption/Kg/ minute while sitting [10]. Maximal oxygen consumption is expressed as ml/kg/minute to allow a meaningful comparison of maximal oxygen consumption between individuals of different body weights [11].
(a) Estimation of MET: Ideally, MET can be derived by dividing the directly measured maximum oxygen consumption by 3.5. In a routine treadmill test, MET is estimated by software, built into the computer system, depending on the duration of exercise (in seconds) [12]. (Figure: 1,2) In addition to the duration of exercise, maximal oxygen consumption is also affected by age, gender and body weight. With advancing age, maximum oxygen consumption declines by approximately 10% per decade in older adults [13]. This is due to decreasing muscle mass, maximum heart rate and stroke volume [13,14]. Maximal oxygen consumption is 10 to 20% higher in men than in women at any age. This is in part because of a greater muscle mass, a higher haemoglobin concentration and a large stroke volume [13]. Heavy persons have to lift their greater weight while walking/running. Obese persons, therefore, consume more oxygen [15]. Various regression equations are used for the calculation of METs at various stages of different protocols [16]. (Figure: 3,4) Regression equations used for calculation of METs in most of the conventional treadmill systems include only exercise duration [10]. Age, gender, exercise habits, heredity and body weight are not included in the regression equations [10] (Figure: 5,6).
(b) Other factors affecting maximal oxygen consumption during the treadmill test: Running requires more oxygen than walking [10,17]. Long stride length requires more oxygen [10,16]. The tight grip on the handrail reduces oxygen uptake [13]. Hyperventilation from anxiety increases oxygen consumption [18]. Patients with lower haemoglobin have lower oxygen consumption [18]. Patients with pulmonary disease have lower maximum oxygen consumption.18 Maximal oxygen consumption is approximately 10% lower during bicycle ergometry testing compared to treadmill testing due to smaller muscle groups used for bicycle exercise [19]. These variables are not incorporated in regression equations used by the software of treadmill test systems [10]. METs, therefore, gives only a rough guide of maximal oxygen consumption [10,20].
(c) Clinical significance of METs: Mets achieved on a treadmill test correlate with all-cause mortality [21,22]. Different exercise protocols produce different magnitudes of workload for the same duration of exercise [15,23]. Increased duration of exercise on a protocol that gives less stress may result in underestimation of a workload. METs allow a comparison of the performance of an exercise test using different protocols, independent of exercise duration [10]. It, therefore, provides a common measure of the performance regardless of the exercise test protocol [2]. Thus the value of METs allows the comparison of treadmill test to be performed at different times in different laboratories. Thus it can help in the evaluation of the progression of the disease.
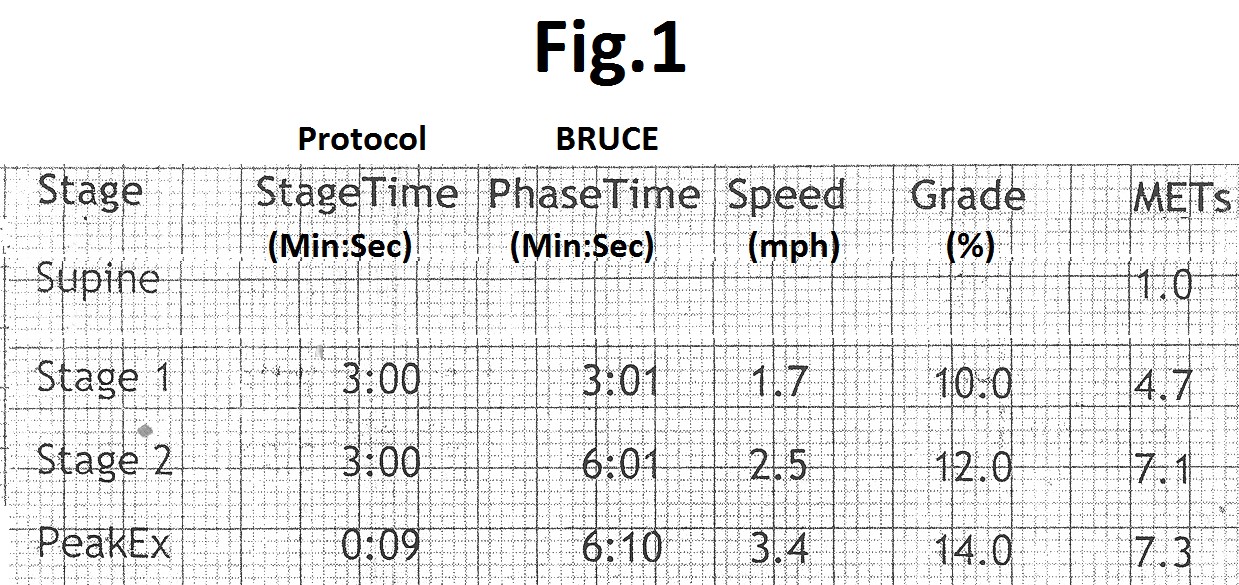
Figure 1: Summary table of treadmill test using Bruce protocol showing the increasing value of METs with increasing duration of exercise (phase time), speed and grade (inclination).

Figure 2: Summary table of treadmill test using Bruce protocol showing the increasing value of METs with increasing duration of exercise (phase time) during same stage (constant speed and grade).

Figure 3: Summary tables of treadmill tests from same patients (a) using Bruce protocol and (b) using modified Bruce protocol showing lower values of METs in modified Bruce protocol (lower treadmill speed and lower grade (inclination) for the same duration of exercise (phase time). This shows that the software used by the treadmill system uses different regression equations for different protocols.

Figure 4: Summary tables of treadmill tests from two patients (a) using Bruce protocol and (b) using modified Bruce protocol showing lower values of METs in modified Bruce protocol even when the duration of exercise (phase time) is more. It also shows that the software used by the treadmill system uses different regression equations for different protocols.
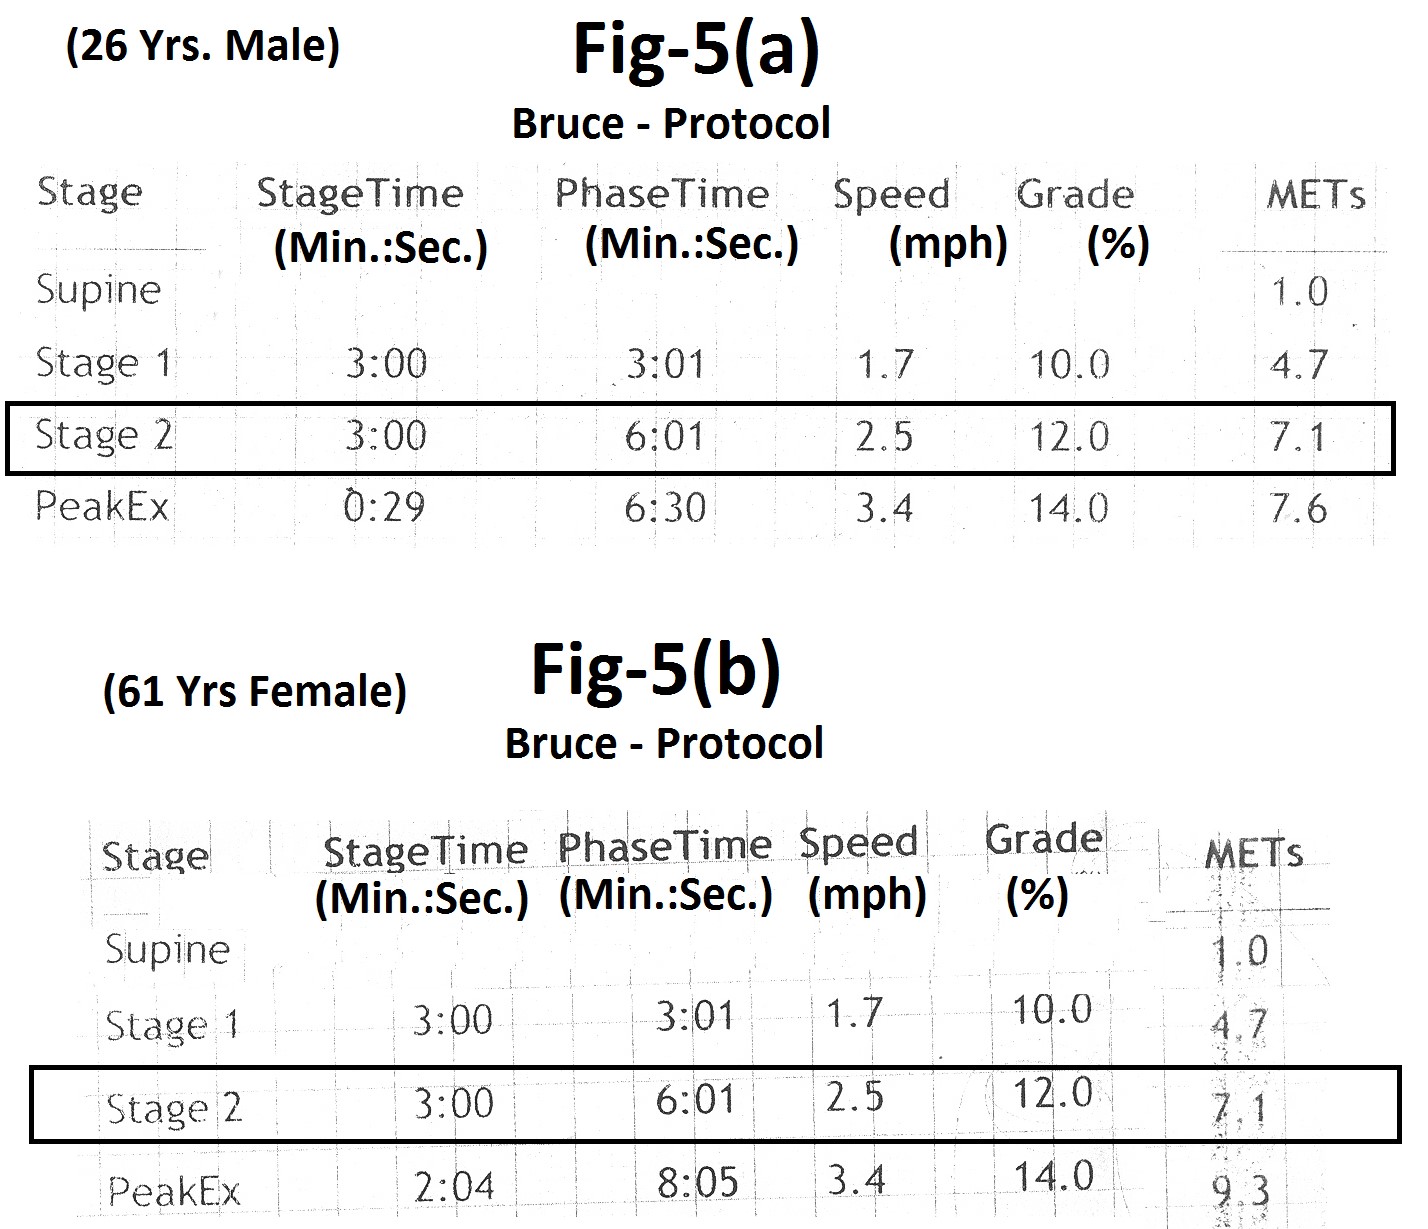
Figure 5: Summary tables of treadmill test from two patients of different age and sex using Bruce Protocol (a) 26 years male (b) 61 years female, showing the same value of METs (7.1) for the same duration (phase time) of exercise. This shows that the regression equation used by the treadmill system does not include age and sex.
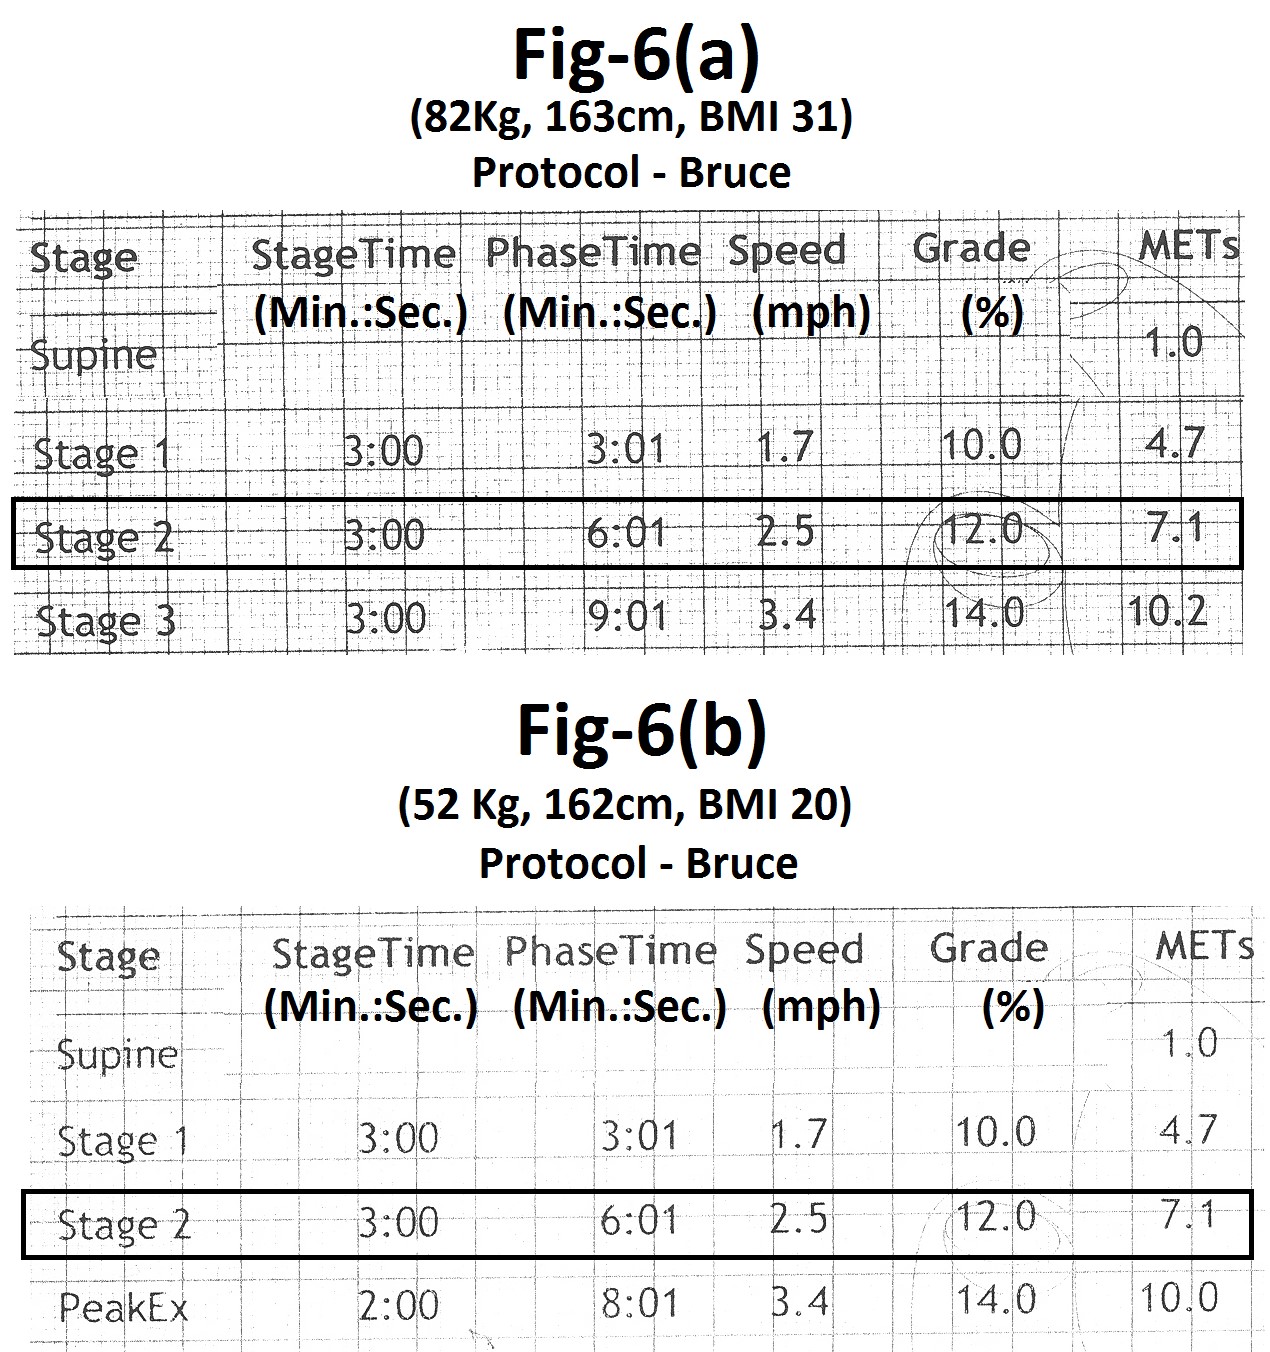
Figure 6: Summary tables of treadmill tests from two patients of different weight and BMI using Bruce protocol (a) height 163 cm, weight 82 Kg, BMI-31 (b) height 162 cm, weight 52 Kg, BMI-20, showing the same value of METs for same duration (phase time) of exercise. This shows that the regression equation used by the treadmill system does not include the weight of the patient.

Figure 7: Summary table of treadmill test showing MET value of 13.5.
Maximum oxygen consumption = (Heart rate x Stroke volume) x Arterial - mixed venous oxygen difference. As arterio-venous oxygen difference is not markedly impaired by heart disease, maximum oxygen consumption (indirectly METs) is linearly related to maximum cardiac output. Therefore, METs achieved can be used to estimate the functional severity of heart disease [10]. Resting left ventricular dysfunction or the amount of further left ventricular dysfunction induced by exercise which can result in lower value of MET [2]. As several factors affect the value of MET achieved by the patient, the low value of MET alone in the absence of other evidence, can not be used to diagnose the presence of myocardial ischemia. In a case with other definitive evidence of myocardial ischemia, a lower value of MET achieved during a symptom-limited maximal stress test may correlate with resting left ventricular dysfunction or the severity of ischemia-induced left ventricular dysfunction.
A maximum MET value of <5 METs suggests a poor prognosis [2]. A value of 10 METs suggests prognosis with medical therapy as good as with coronary artery bypass surgery [24]. A value of 13 METs (Figure: 7) suggests an excellent prognosis regardless of other exercise responses [25]. Stress imaging studies provide no added prognostic information for patients who achieve a workload of 10 or more METs during exercise testing [24-26]. A major or sudden reduction in MET level should suggest further evaluation [28].
Metabolic equivalents and cardiopulmonary function
Functional capacity (METs) correlates with maximum oxygen consumption and indirectly with cardiopulmonary functions provided there are no other confounding factors as anaemia or arterial desaturation , Higher values of MET suggest better cardiopulmonary function. However, it’s use in clinical care is limited [29] because of several variables affecting the value of MET. Functional capacity is lower in women and decreases with age in both genders [13]. For example, a value of six METs in a 30- year- old male suggests relatively poor cardiopulmonary function then the same value in a 50- year- old female. Maximum oxygen consumption also depends on weight of an individual [13]. Therefore, a particular value of MET in an obese person suggest better cardiopulmonary function then similar value of MET in a lean person. Maximal oxygen consumption increase linearly with increasing duration of exercise [12]. However, during conventional treadmill testing, value of MET increases only with the change of stage. For example, MET value will be the same for a person whose exercise durations is 3 minutes and 2 seconds as compared to another person who has exercised for 5 minutes and 59 seconds. Cardiopulmonary functions of the second person are certainly better than those of the first person although both show the same value of MET. Another limitations of MET in relation to cardiopulmonary function is that some persons may continue exercise even after reaching their maximal aerobic capacity by using anaerobic metabolism [7]. For this reason, there can be significant difference in actual maximal oxygen consumption and METs calculated by the software of the treadmill systems [10,31]. Maximal oxygen consumption also depends on muscle mass [12]. Persons with higher muscle mass have higher oxygen consumption then those with lower muscle mass. Muscle mass is also not included in the regression equations used for calculation of MET. Therefore, for the same value of MET, a person with greater muscle mass has better cardiopulmonary functions.
Conclusion
Both exercise duration and METs give an impression about the effort tolerance of the patient. Regression equations for the calculation of METs also include speed and inclination of the treadmill (stage of protocol) in addition to the duration of exercise. METs, therefore, give a more correct impression about the workload achieved by the patient. For the same reason, METs is useful for comparing the findings from performed treadmill tests using different protocols at different times.
References
1. Balady GJ, Morise AP. 2019. Exercise Electrocardiographic Testing. In: Zipes DP, Libby P, Bonow RO, Mann DL, Tomaselli GF (eds). Braunwald’s Heart Disease. Elsevier, Philadelphia. 2019: 154-173.
2. Gibbons RJ, Balady GJ, Bricker JT. 2002. ACC/AHA 2002 Guideline update for Exercise Testing. A report of the American College of Cardiology/ American Heart Association Task Force on Practice Guidelines (Committee on Exercise Testing) 2002. Ref.: https://pubmed.ncbi.nlm.nih.gov/12392846/ DOI: https://doi.org/10.1016/s0735-1097(02)02164-2
3. Myers J, Prakash M, Froelicher V. 2002. Exercise capacity and mortality among men and women referred for exercise testing. N Engl J Med. 346: 739-801. Ref.: https://pubmed.ncbi.nlm.nih.gov/11893790/ DOI: https://doi.org/10.1056/nejmoa011858
4. Kodama S, Saitok K, Tanaka S. 2009. Cardiorespiratory fitness as a quantitative predictor of all-cause mortality and cardiovascular events in healthy men and women: a meta-analysis. JAMA. 301: 2024-2035. Ref.: https://pubmed.ncbi.nlm.nih.gov/19454641/ DOI: https://doi.org/10.1001/jama.2009.681
5. Gulati M, Pandey DK, Arnsdorf MF. 2003. Exercise capacity and the risk of death in women. Circulation. 108: 1554-1559. Ref.: https://pubmed.ncbi.nlm.nih.gov/12975254/ DOI: https://doi.org/10.1161/01.cir.0000091080.57509.e9
6. Weiner DA, Ryan TJ, McCabe OH. 1984. Prognostic importance of clinical profile and exercise test in medically treated patients with coronary artery disease. J Am Coll Cardiol. 3: 772-779. Ref.: https://pubmed.ncbi.nlm.nih.gov/6229569/ DOI: https://doi.org/10.1016/s0735-1097(84)80254-5
7. Sullivan M, Mc Kirnan MD. 1984. Errors in predicting functional capacity for postmyocardial infarction patients using a modified Bruce protocol. Am Heart J. 107: 486-492. Ref.: https://pubmed.ncbi.nlm.nih.gov/6695692/ DOI: https://doi.org/10.1016/0002-8703(84)90090-5
8. Kim LS, Ishwaran H, Blackstone E. 2007. External prognostic validation and comparisons of age and gender-adjusted exercise capacity predictions. J Am Coll Cardiol. 50: 1867-1875. Ref.: https://pubmed.ncbi.nlm.nih.gov/17980254/ DOI: https://doi.org/10.1016/j.jacc.2007.08.003
9. Thomas GS, Ellestad MH. 2017. Electrocardiographic exercise testing. In: Fuster V, Harrington RA, Narula J, Eapen ZJ (eds). Hurst’s The Heart. Mc graw Hill, New York. 2017: 318-334.
10. Thomas GS, Ellestad MH. 2018. Parameters to be measured during exercise. In: Thomas GS, Wann LS, Ellestad MH (eds). Ellestad’s stress testing. Oxford, UK. 2018: 82-105.
11. Sylvies FR, Ellestad MH. 2018. Cardiovascular and pulmonary responses to exercise. In: Thomas GS, Wann LS. Ellestad MH (eds). Ellestad’s stress testing. Oxford. UK. 2018: 373-412.
12. Bruce RA, Kusumi F, Hosmer D. 1973. Maximal oxygen intake and nomographic assessment of functional aerobic impairment in cardiovascular disease. Am Heart J. 85: 546-562. Ref.: https://pubmed.ncbi.nlm.nih.gov/4632004/ DOI: https://doi.org/10.1016/0002-8703(73)90502-4
13. Arena R, Myers J, Williams MA. 2007. Assessment of functional capacity in clinical and research settings. Circulation. 116: 329-343. Ref.: https://pubmed.ncbi.nlm.nih.gov/17576872/ DOI: https://doi.org/10.1161/circulationaha.106.184461
14. Flag JL, Morrell CH, Bos AG. 2005. Accelerated longitudinal decline of aerobic capacity in healthy older adults. Circulation. 112: 674-682. Ref.: https://pubmed.ncbi.nlm.nih.gov/16043637/ DOI: https://doi.org/10.1161/circulationaha.105.545459
15. Baronchi LAV, Baroncini CV, Leal JF. 2019. Correlation between exercise stress test and echocardiographic parameters in elderly individuals. Int J Cardiovasc Sci. 32: 19-27.
16. Pollock ML, Bohanon RL, Kooper KH. 1976. A comparative analysis of four protocols for maximal treadmill stress testing. Am Heart J. 92: 39-46. Ref.: https://pubmed.ncbi.nlm.nih.gov/961576/ DOI: https://doi.org/10.1016/s0002-8703(76)80401-2
17. Astrand PO. 1984. Principles in ergometry and their implications in sports practice International J Sports Med. 5: 102-105.
18. Kao A. 2018. Cardiopulmonary exercise testing. In: Thomas GS, Wann LS, Ellestad MH (eds). Ellestad’s Stress Testing. Oxford, UK. 2018: 413-436.
19. Hermansen L, Saltin B. 1969. Oxygen uptake during maximal treadmill and bicycle exercise. Journal of applied physiology. 26: 31-37. Ref.: https://pubmed.ncbi.nlm.nih.gov/5762873/ DOI: https://doi.org/10.1152/jappl.1969.26.1.31
20. Fletcher GF, Ades PA, Kligfield P. 2013. Exercise standard for testing and training: a scientific statement from the American Heart Association. Circulation. 128: 873-934. Ref.: https://pubmed.ncbi.nlm.nih.gov/23877260/ DOI: https://doi.org/10.1161/cir.0b013e31829b5b44
21. Ahmad HM, Al Math MH, Mc Evoy JW. 2015. Maximum exercise testing variables and 10-year survival: fitness risk score derivation from the FIT project Mayo Clin Proc. 90: 346-355. Ref.: https://pubmed.ncbi.nlm.nih.gov/25744114/ DOI: https://doi.org/10.1016/j.mayocp.2014.12.013
22. Blair SN, Kohl HW, Paffenbarger RS. 1989. Physical fitness and all-cause mortality: a prospective study of healthy men and women. JAMA. 262: 2395- 2401. Ref.: https://pubmed.ncbi.nlm.nih.gov/2795824/ DOI: https://doi.org/10.1001/jama.262.17.2395
23. Chaitman BR. 2012. Exercise Stress Testing. In: Bonow RO, Mann DL, Zipes DP, Libby P (eds). Braunwald’s Heart Disease, Elsevier, Missouri. 168.
24. Fine NM, Pollikka PA, Scott CG. 2013. Characteristics and outcomes of patients who achieve high workload (>10 Metabolic Equivalents) during treadmill exercise echocardiography. Mayo Clin Proc. 88:1408-1419. Ref.: https://pubmed.ncbi.nlm.nih.gov/24290114/ DOI: https://doi.org/10.1016/j.mayocp.2013.07.021
25. Engel G, Froelicher VF. 2008. ECG exercise testing. In: Fuster V, Walsh RA, Harrington RA (eds). Hurst’s The Heart. Mc Graw Hill, New York. 324.
26. Bourque JM, Holland BH, Watson DD. 2009. Achieving an exercise workload of > or =10 metabolic equivalents predicts a very low risk of inducible ischemia: does myocardial perfusion imaging have a role? J Am Coll Cardiol. 54: 538-545. Ref.: https://pubmed.ncbi.nlm.nih.gov/19643316/ DOI: https://doi.org/10.1016/j.jacc.2009.04.042
27. Bourque JM, Charfton GT, Holland BH. 2011. Prognosis in patients achieving >/= 10 METs on exercise stress testing: was SPECT imaging useful. J Nucl Cardiol. 18: 230-237. Ref.: https://pubmed.ncbi.nlm.nih.gov/21132417/ DOI: https://doi.org/10.1007/s12350-010-9323-2
28. Giallauria F, Grieco A, Russo A. 2011. Exercise stress testing in clinical practice. Reviews in Health Care. 2: 171-184.
29. Sharif S, Alway S. 2016. The diagnostic value of exercise stress testing for cardiovascular disease is more than just ST segment changes : A review. J Integr Cardiol. 2: 341-355.
30. Sydu N, Abdelmoneim SS, Mulvagh SL. 2014. Relationship between exercise heart rate and age in men v/s women. Mayo Clin Proc. 89: 1664-1672. Ref.: https://pubmed.ncbi.nlm.nih.gov/25441400/ DOI: https://doi.org/10.1016/j.mayocp.2014.08.018
31. Froelicher VF, Thompson A, Naguera I. 1975. Prediction of maximal oxygen consumption: comparison of the Bruce and Balkc treadmill protocols. Chest. 68: 331-336. Ref.: https://pubmed.ncbi.nlm.nih.gov/1157538/ DOI: https://doi.org/10.1378/chest.68.3.331