
-
Mail us:
editor@raftpubs.org
Indexing & Abstracting
Full Text
Research ArticleDOI Number : 10.36811/jvsr.2020.110011Article Views : 23Article Downloads : 19
High Fat Diet Load Study in a Natural Obesity-Resistant Animal Model, Suncus murinus
Ming-Shou Zhang1, Yi-Dan Dai1, Hiraku Sasaki2, Hayato Terayama3, Ke Ren1,4, Zhi-Dan Wang1, Jue-Fei Chen1, Yasuhiko Yamamoto5 and Shuang-Qin Yi1*
1Department of Frontier Health Sciences, Graduate School of Human Health Sciences, Tokyo Metropolitan University, Tokyo, Japan
2Department of Health Science, School of Health and Sports Science, Juntendo University, Chiba, Japan
3Department of Anatomy, Division of Basic Medical Science, Tokai University School of Medicine, Kanagawa, Japan
4Project Division for Healthcare Innovation, Graduate School of Human Health Sciences, Tokyo Metropolitan University, Tokyo, Japan
5Department of Biochemistry and Molecular Vascular Biology, Graduate School of Medical Sciences, Kanazawa University, Kanazawa, Japan
*Corresponding Author: Shuang-Qin Yi, M.D, Ph.D, Department of Frontier Health Sciences, Graduate School of Human Health Sciences, Tokyo Metropolitan University, 7-2-10, Higashiogu, Arakawa-ku, 116-8551 Tokyo, Japan, Tel: +81-3-3819-1211; Email: yittmniu@tmu.ac.jp
Article Information
Aritcle Type: Research Article
Citation: Zhang MS, Dai YD, Sasaki H, et al. 2020. High Fat Diet Load Study in a Natural Obesity-Resistant Animal Model, Suncus murinus. J Veterina Sci Res. 2: 19-29.
Copyright: This is an open-access article distributed under the terms of the Creative Commons Attribution License, which permits unrestricted use, distribution, and reproduction in any medium, provided the original author and source are credited. Copyright © 2020; Ming-Shou Zhang
Publication history:
Received date: 29 May, 2020Accepted date: 10 June, 2020
Published date: 12 June, 2020
Abstract
Our previous study, demonstrated the obesity-resistant phenomenon in the House musk shrew, Suncus murinus (S. murinus). In order to go further to explore the mechanism of the phenomenon of natural obesity resistance in S. murinus, we focused on the effects of diet on fat accumulation and metabolism. In this study, four-week-old male S. murinus were assigned to 1 of 2 experimental groups (n = 6 per group) and fed either a high-fat diet (HFD) or a normal trout diet (NTD) for 24 weeks. Body weight, food ingestion, visceral fat distribution, blood biochemistry and fecal lipids were monitored and analyzed in the HFD and NTD groups. It was found no differences in the average final body weight or body fat change between the two groups. Although animals fed HFD had similar serum triglyceride concentration to animals fed NTD, they had significantly higher phospholipid and total cholesterol concentrations than the NTD group. Furthermore, fecal lipid levels in the HFD group was significantly higher than those in the NTD group, suggesting that diet composition or energy density of the diet affects blood biochemistry. Although NTD-fed S. murinus had higher food ingestion than HFD-fed S. murinus, caloric intake remained almost the same. We speculated S. murinus may suppress obesity and control fat accumulation by controlling calorie intake. These results suggest that the obesity characteristics of S. murinus are not primarily due to dietary factors but to other mechanisms of regulation.
Keywords: High fat diet; Mesenteric fat; Obesity-resistant; Suncus murinus
Introduction
Obesity is defined as excessive fat accumulation that leads to higher risk of associated co-morbidities including diabetes, cancer and cardiovascular disorders [1]. Worldwide, the prevalence of obesity has nearly tripled since 1975, with 39% of adults worldwide being overweight and 13% being obese [2]. Estimations from the noncommunicable diseases collaboration reported that if these trends continue, then by 2025, global obesity prevalence will reach 18% in men and surpass 21% in women, and severe obesity will surpass 6% in men and 9% in women [3]. Thus, more attention should be paid to the significant and interrelated public health issues related to obesity. What has caused this rapid increase in obesity within less than one generation? The past century has seen marked changes in human lifestyle, ranging from new dietary patterns to improved hygiene and altered sleep-wake cycles [4]. The high prevalence of obesity may be partially attributed to increasing consumption of hypercaloric foods and sedentary lifestyle [2, 5]. To develop new therapeutic treatment or dietary interventions, a study model for obesity should be developed. A number of animal models have been developed [6-9]; however, there are no suitable resistant to human-type obesity animal models. The house musk shrew, Suncus murinus, is a small mammal that belongs to the order Insectivora, family Soricidae and genus Suncus, and lives in houses and grassy areas near human habitations or in cattle pens. S. murinus eat insects and worms, is nocturnal [10-12], and widely distributed throughout Asia and East Africa [13, 14]. In Japan, presumably native populations are distributed in the Nansei Islands [the Amami, Okinawa, Miyako and Yaeyama Islands]. S. murinus was established from wild animals as a laboratory model system in Japan, and strains differ in body weight [15]. Because S. murinus has different characteristics to mice and rats, they have been widely used for physiological and morphological experiments [16]. S. murinus are reported to possess features closer to those of primates than rodents on the basis of, for example, mitochondrial DNA sequences [17, 18]. This species has been used in various fields of science due to its unique characteristics compared with laboratory rodents, including use as models of emesis, and utilization for studies of cold intolerance and brown adipose tissue [19-21]. Further more, S. murinus has a visceral system that is very similar to that of humans and is a useful model of human physiology and pathophysiology [10-12, 22-29]. In our previous study, we investigated the obesity-resistant phenomenon in S. murinus [26]. Body weight changed little during growth (aging) from 2 months up to 12 months of age, and less visceral fat accumulated; in particular, mesenteric fat accumulation did not occur until old age in this species. Thus, S. murinus may be a suitable model for investigating obesity and metabolic syndrome, particularly the mechanism of obesity resistance [26]. In the present study, in order to go further to explorethe mechanism of the phenomenon of natural obesity resistance in S. murinus, we focused on the effects of diet on fat accumulation and metabolism. Body weight, food ingestion, visceral fat distribution, blood biochemistry and fecal lipids were monitored and analyzed in S. murinus fed on high-fat and normal trout diets.
Materials and Methods
House musk shrew, Suncus murinus
The experiment was performed using S. murinus (male, n = 12, 4-week-old) obtained from a closed breeding colony, JIc: KAT-c, at our laboratory [22, 25]. All animals were housed in polycarbonate cages in a room maintained at 28 ± 2 C? with relative humidity of 50 ± 5% in the Functional Morphology Laboratory, Department of Frontier Health Sciences, Tokyo Metropolitan University, Japan. The room was automatically lit between 9:00 h and 21:00 h. Pellets and water were supplied ad libitum.
Experimental design and procedure
All experimental procedures were approved by the institutional Animal care utilization committee of Tokyo Metropolitan University and performed in accordance with institution guidelines (No. A31-34). The twelve male S. murinus were randomly divided into two groups and fed either a high-fat diet (HFD group, n = 6, weight 55.30 ± 5.94 g), Purina One (Nestle Inc., St. Louis, USA), which is tender selects blend with real chicken adult dry cat food for kitty cats; or a normal trout diet (NTD group, equivalent to a general diet chow, n = 6, weight 63.92 ± 8.03 g), which is a specific and natural food of this insectivorous species (Oriental Yeast Co., Ltd. Bioindustry Division, Chiba, Japan). The contents and metabolizable energy contents of the diets arelisted in Table 1. In addition, the animals from the same litter were separated into the two groups, and there was no significant difference in mean body weight between the two groups in the initial stage of the experiment (p > 0.05).
|
Table 1: Formulation of the high-fat diet and normal trout diet |
|||||||||
|
|
|
|
|
|
|
|
|
|
|
|
|
Protein % |
Fat % |
Fiber % |
Ash % |
Carbohydrate % |
H2O % |
Others % |
Kcal / 100g |
|
|
Trout diet |
45 |
4 |
3 |
15 |
26.2 |
6.8 |
357 |
||
|
Purina one |
40 |
18 |
2.5 |
9 |
14.6 |
12 |
3.9* |
440 |
|
|
* Others: 1.0% calcium, 0.8% phosphorus, 0.1% magnesium, 0.18% taurine, 1.8% linoleic acid, and Vitamin A, E and D |
|||||||||
Determination of body weight and food consumption
To characterize weight gain and energy ingestion, body weight and food consumption were monitored weekly.
Determination of serum fat parameters
After 24 weeks, the animals were sacrificed by anesthesia. Blood was collected and centrifuged at 3000 rpm for 10 min at , and serum chemistry for total cholesterol (TCho) (Co. 439-17501; Wako Inc., OSA, Japan), triglycerides (TG) (Co. 432-40201; Wako Inc., OSA, Japan) and phospholipids (PL) (Co. 433-36201; Wako Inc., OSA, Japan) was analyzed using an automatic chemistry analyzer according to the manufacturer's protocol.
Measurement of the quantity of lipid in feces
According to the manufacturer's protocol, fresh feces were collected from the cages and oven-dried for 12 hours at 65 to evaporate the water. 0.5 g of the dried feces were extracted using 10 ml of concentrated hydrochloric acid (12 mol/dm3) for 30 min at a constant temperature of 37 in a water bath. Then, 50 ml ether was added after cooling, after shock to be stratified, and 25 ml of supernatant was collected into another test tube. After allowing the ether to evaporate completely at room temperature, the lipid extract was weighed.
Statistical analysis
The data are displayed as mean and standard deviation [mean ± SD]. Differences between the groups were analyzed with the Students t test and a p value < 0.05 was considered significant (GraphPad Prism 5.1, GraphPad Software, La Jolla, CA, USA).
Results
Body weight
The changes in body weight in the two S. murinus groups during the experiment period are shown in figure 1. At 24 weeks of the experiment, the HFD and the NTD groups had a mean weight of 86.02 ± 6.99 g and 83.57 ± 8.91 g, respectively, no significant difference between HFD group and NTD group (p = 0.6085). During the study period, the body weight gained in HFD group and NTD group were 29.18 ± 11.27 g and 21.33 ± 4.64 g, respectively, it was not significantly higher in the NTD group (p = 0.1609).
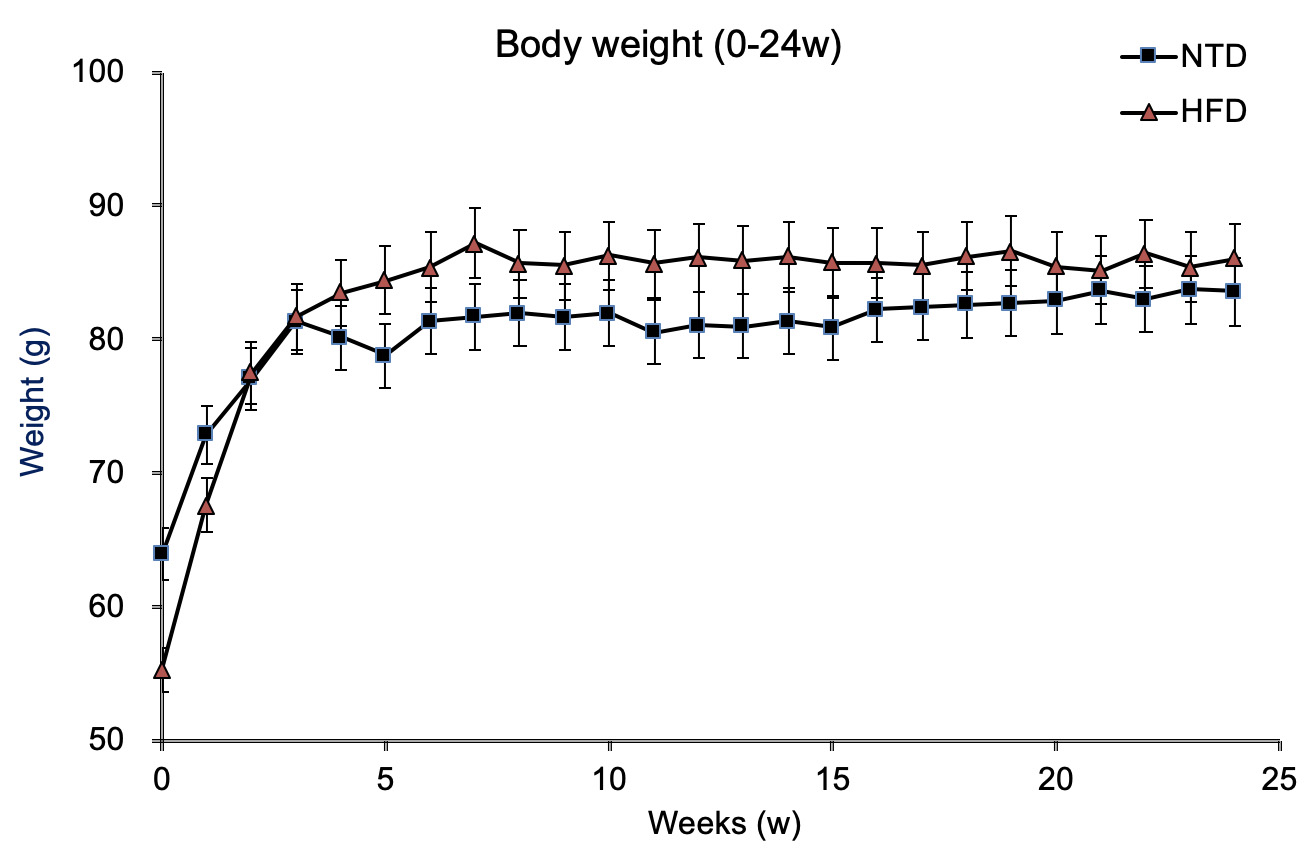
Figure 1: Body weights of S. murinus over the 24-week experimental period.
Food ingestion
The changes in food ingestion in the two S. murinus groups were shown in figure 2. The quantity of food ingested was significantly lower in the HFD group than the NTD group from the beginning of the study (5.73 ± 0.68 vs 4.44 ± 0.37 g/day, p < 0.001). However, the average energy ingested per day during the entire study was not significantly higher in the HFD group than in the NTD group (19.55 ± 1.64 vs 20.47 ± 2.44 Kcal/day, p = 0.1012).
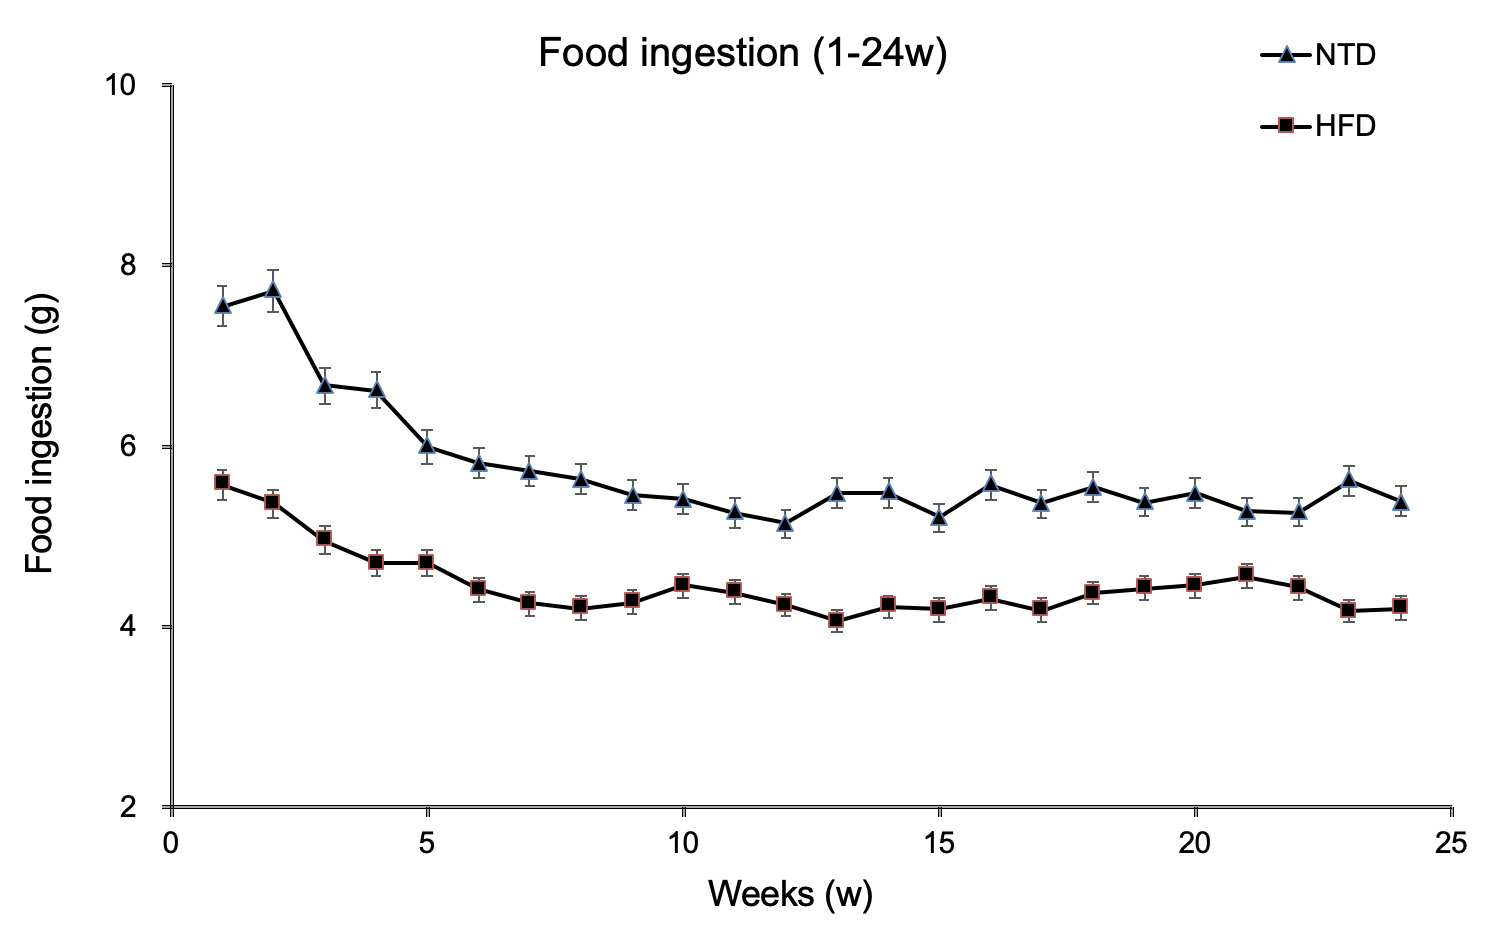
Figure 2: Food ingestion of S. murinus over the 24-week experimental period. There was a significant difference between the groups (p < 0.001).
Body fat
To examine the effect of HFD supplementation on body fat distribution, we performed laparotomy after completion of the study and evaluated changes in body fat. The distribution and quantity of subcutaneous white fat, epididymal fat, mesenteric fat (Figure 3) and retroperitoneal fat (data not shown) were not markedly different between the two groups.
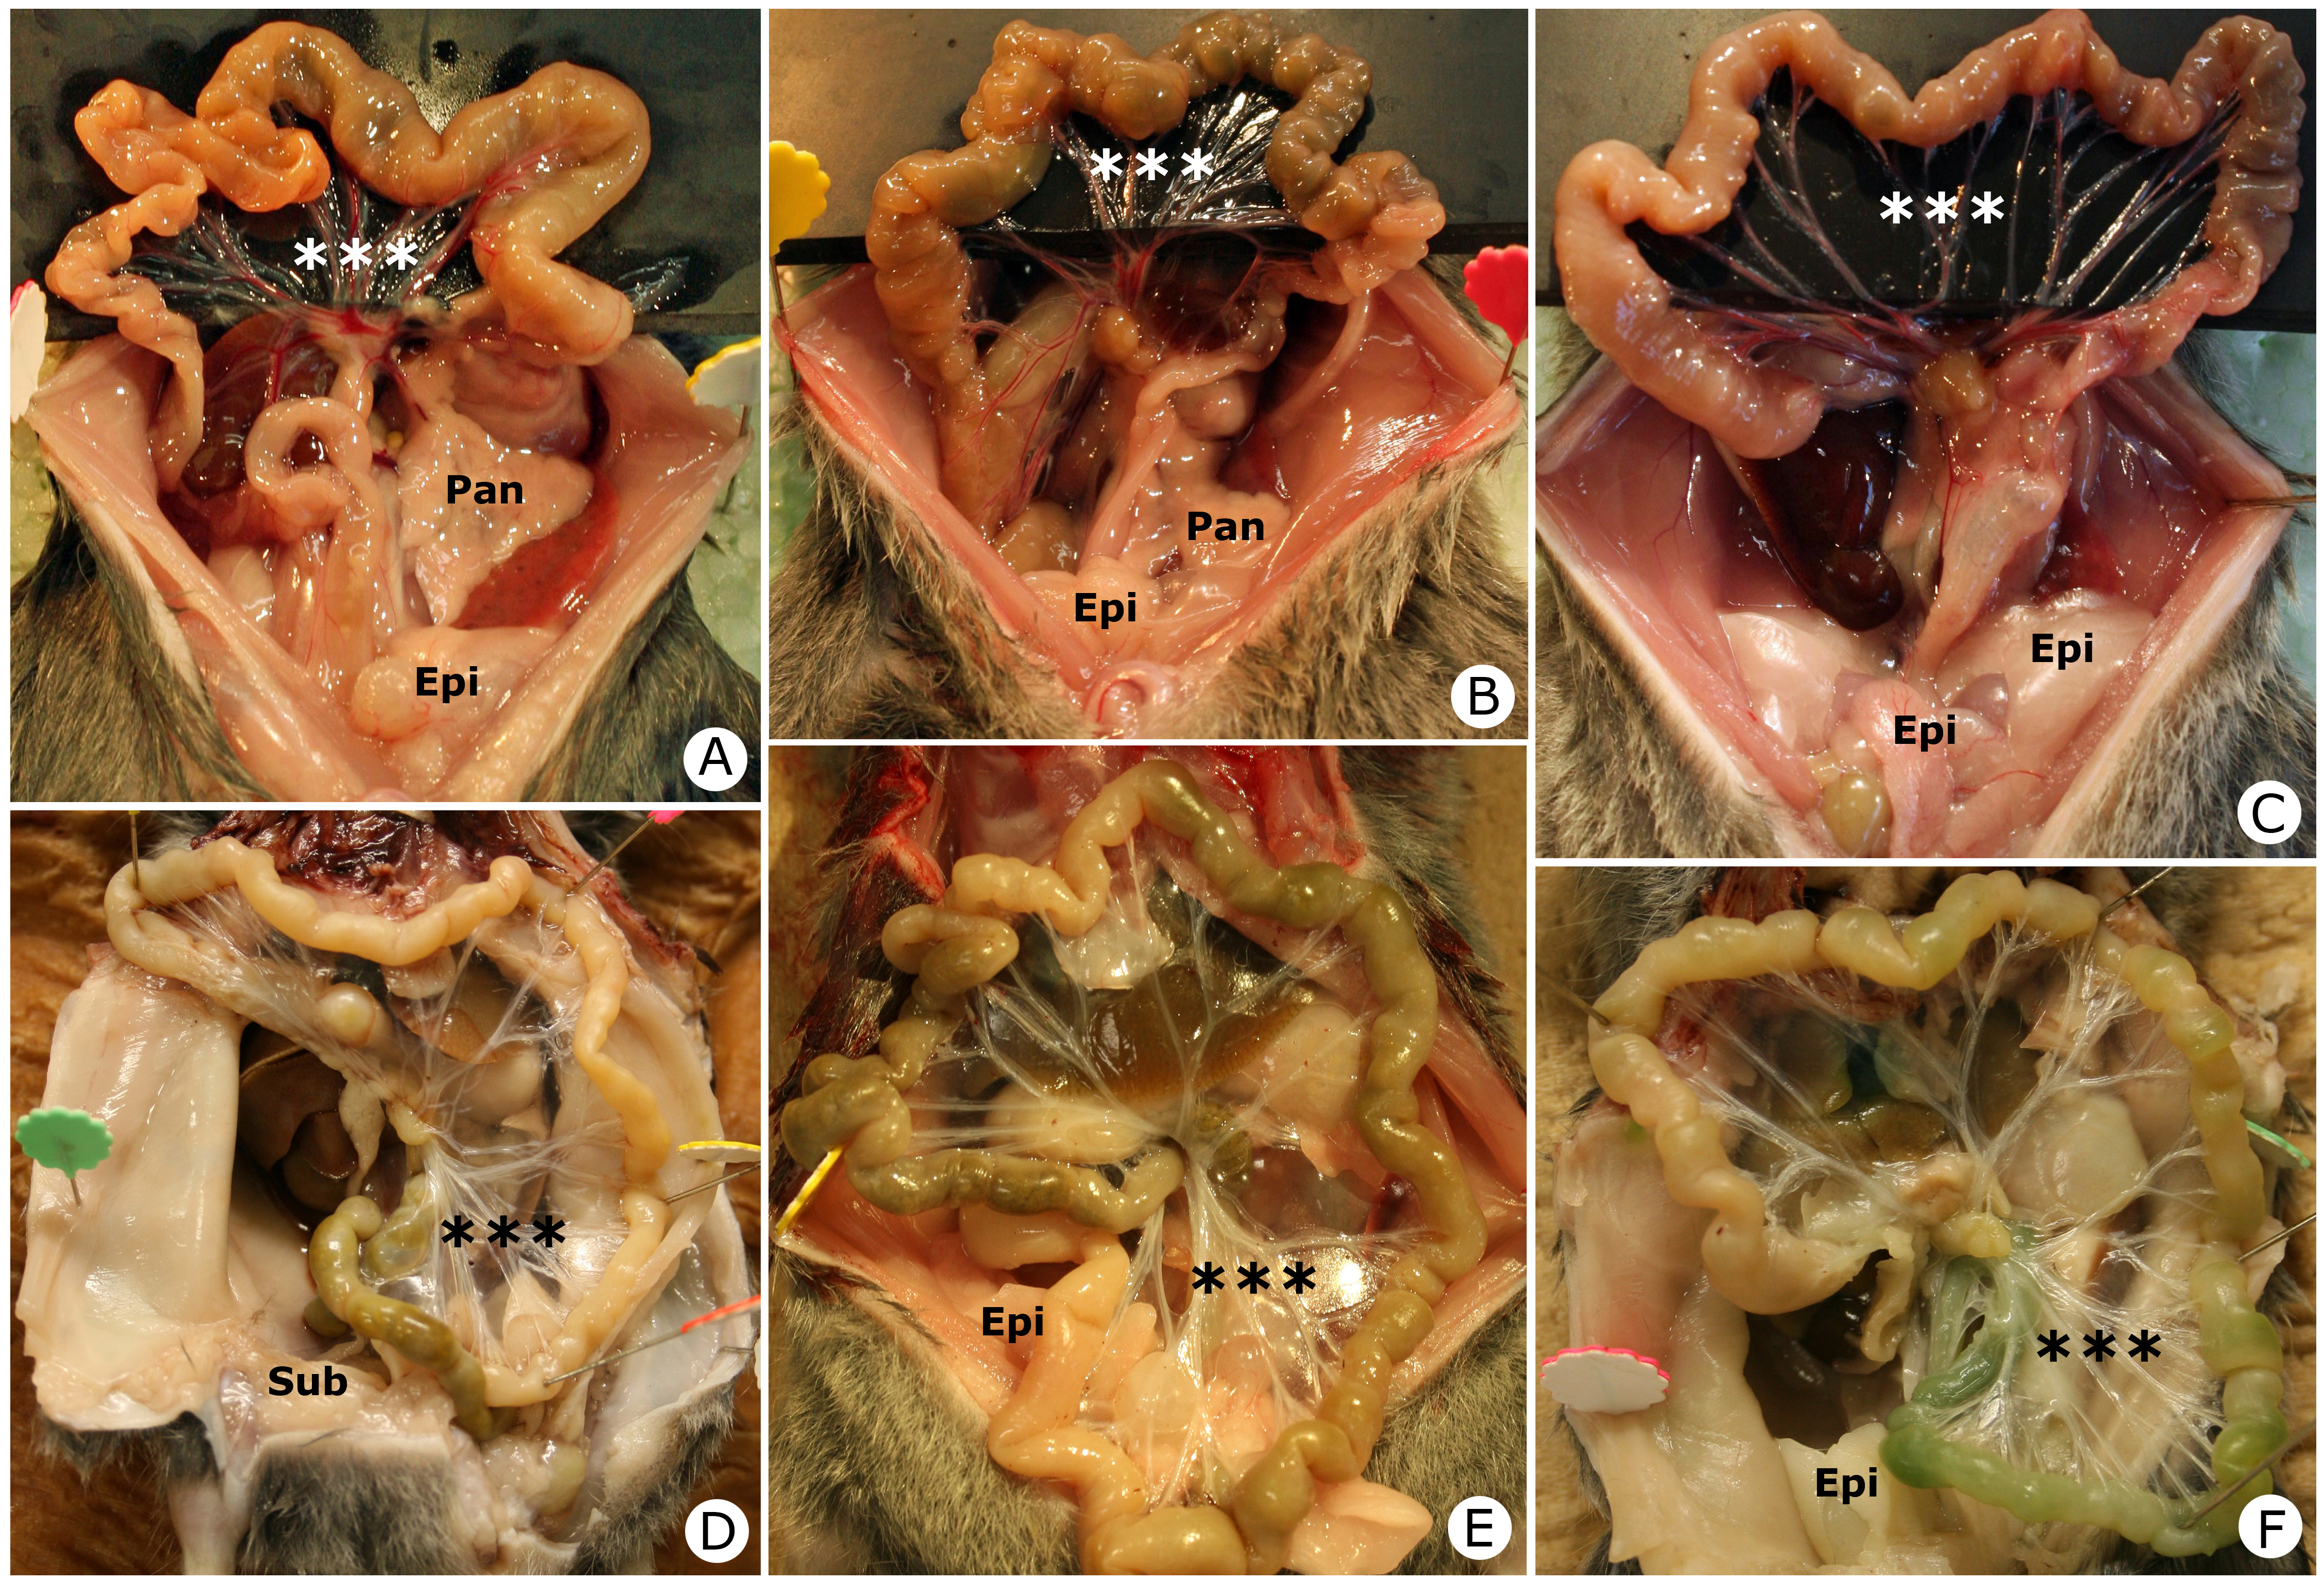
Figure 3: Representative body fat pictures of the HFD group (A, B and C) and NTD group (D, E and F) for each experiment after 24 weeks of treatment.***, mesenterium; Epi, epididymal fat pad; Pan, pancreas; Sub, subcutaneous fat.
Blood biochemistry
The serum phospholipid and total cholesterol concentrations were significantly increased in the HFD group compared with the NTD group (p = 0.003859 and p < 0.001, respectively); however, the concentration of triglyceride was similar between two groups (p = 0.0803) (Figure 4).
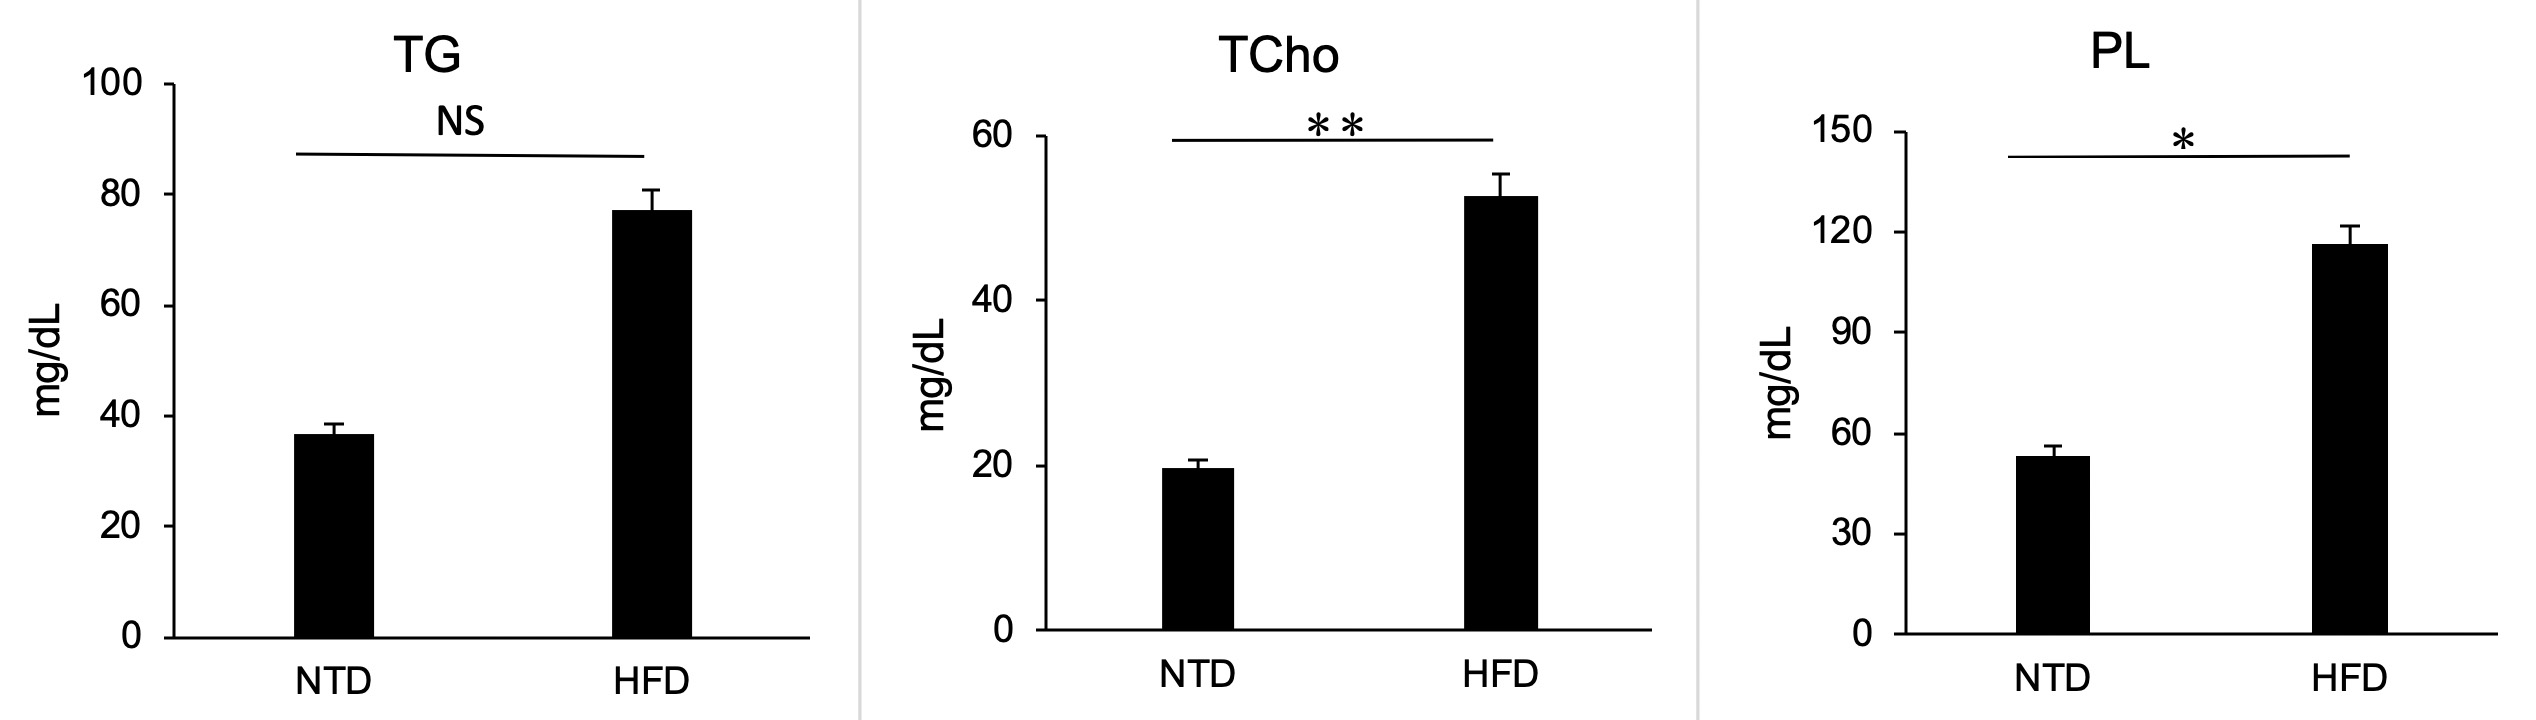
Figure 4: Serum triglyceride (TG), phospholipid (PL) and total cholesterol concentrations (TCho) in S. murinus in the HFD and NTD groups after 24 weeks of treatment. Between the two groups, there were significant differences in PL (*p < 0.05) and Tcho (**p < 0.001), and no significant difference in TG (p > 0.05).
Fecal lipids
The fecal excreted by S. murinus was displayed as semisolid state in the HFD group, while it was presented as solid one in the NTD group. The fecal lipid level in the HFD group was significantly higher than that in the NTD group (0.0154 ± 0.0006 vs 0.0106 ± 0.0033, p = 0.0287) (Figure 5).
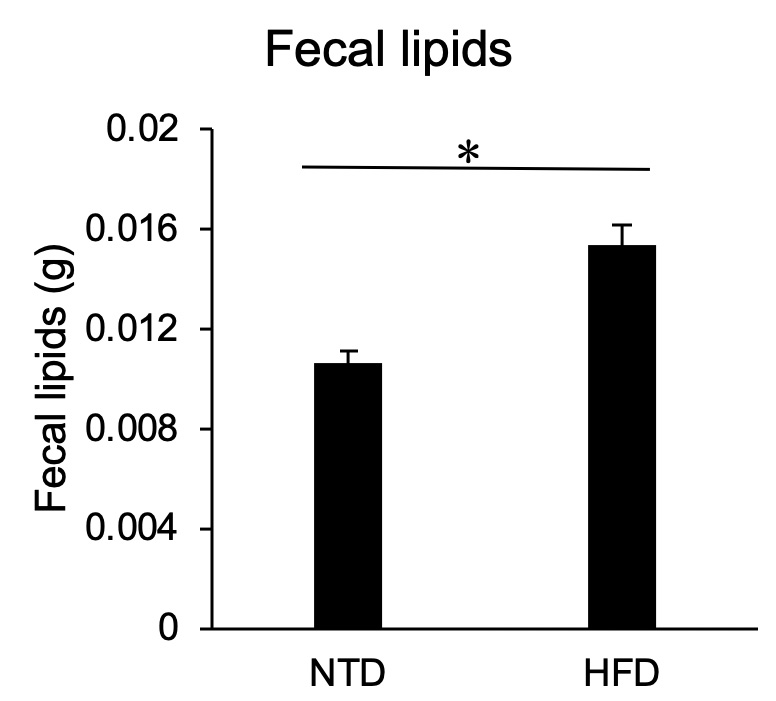
Figure 5: Fecal lipids levels in S. murinus after feeding in the HFD group and NTD group. There was a significant difference between two groups (*p < 0.05).
Discussion
In this study, we examined the mechanism of obesity-resistance in S. murinus, a novel and naturally obesity-resistant animal model [26]. Body weight, food ingestion, visceral fat distribution, blood biochemistry and fecal lipids were examined and analyzed in the animals fed high-fat diet or normal trout diet. We found no significant changes in body weight or fat distribution. However, changes in blood serum fat were significantly different between the two groups. Interestingly, food intake was significantly higher in the NTD group and fecal lipids were significantly higher in the HFD group.
In our preliminary experiment, the high-fat diets HFD45 and HFD32 that are commonly used for mice or rats were first selected, but the experiment could not proceed because S. murinus refused to eat them. Therefore, the diet was changed to Purina One with a fat content of 18.0%, which the animals consumed. Purina One has more than four times the fat content of the conventional NTD of S. murinus (4.0%). Calorie levels for the HFD and NTD are 440 Kcal/100g vs 357 Kcal/100g, respectively, and HFD is 23% higher than NTD. Although our study did not use the conventional HFD30-50 as a high-fat diet, we don’t think this will affect the study of the effects of higher fat, higher calorie diets on S. murinus fat metabolism and deposition.
The present study showed that HFD feeding for 24 weeks in S. murinus did not significantly increase body weight, subcutaneous white adipose or visceral fat compared with NTD-fed S. murinus. In particular, mesenteric fat was not observed in the HFD group. Several different mechanisms have been speculated in our previous study [26], including growth environment, structure of the gastrointestinal tract, diet composition and existence or differentiation of mesenteric adipose stem cells of S. murinus, but the actual mechanism was unclear. In the present study, we found that food intake was significantly higher in the NTD group than the HFD group (p < 0.001) from the beginning of the experiment. However, interestingly, daily calorie intake was not significantly different between the two groups. Thus, we speculate that S. murinus suppressed obesity and controlled fat accumulation by controlling calorie intake. Different theories have been suggested such as absorbed calories may provide feedback on food intake. Another possibility is that the autonomic nervous system controls the flow of energy through regulation of storage and mobilization of nutrients as well as by regulating the flow of energy through valve uncoupled, which does not generate ATP. Alternatively, the sympathetic nervous system may have an important role in the regulation of metabolism and the long-term maintenance of energy balance [30].
We also evaluated the baseline pathological data of S. murinus fed HFD including serum fat and fecal fat. The results showed that phospholipids and total cholesterol were significantly increased (p < 0.05 and p < 0.001, respectively), while triglyceride concentration did not significantly change in the HFD group. Triglyceride fractions in blood are considered to be influenced by the type and amount of fat consumed during recent meals [31]. Since triglyceride levels did not significantly change, we speculate that the amount of fat consumed was almost the same between the two groups. Serum phospholipids mirror the dietary intake of recent months and, roughly, the composition of body fat [32]. Numerous studies have shown that cholesterol intake is closely related to dyslipidemia. This is because the intake of high fat can increase the secretion of bile acids in the intestine, and this increase promotes the absorption of cholesterol in the daily diet and a subsequent increase in cholesterol in the blood [33]. Our results suggest that a high-fat diet increases cholesterol levels in S. murinus. The most likely explanation for the obesity-resistance in S. murinus may be that this species possesses specific metabolic effect of differing proportions of fat and carbohydrate in the diet.
In this study, the fecal fat extracted in the HFD group was higher significantly than in the NTD group (p < 0.05). This increase in fecal lipid contents may be due to the changes in cholesterol and triglyceride absorption in the intestines. It was suggested that the undigested protein influences gut absorptive function by either blocking the absorption or sequestering of cholesterol, thereby enhancing the excretion of cholesterol via feces [34]. Nevertheless, the increased excretion of fecal lipids partly explains the obesity resistance in HFD-fed S. murinus. Therefore, we suggest that increases in fecal fat excretion may be due to a decrease in fat absorption in S. murinus. Thus, we speculated that the HFD group had malabsorption based on semisolid excrement compared with that in the NTD group. In conclusion, based on our and previous findings, a high-fat diet does not induce obesity in S. murinus. This may be because S. murinus fed HFD may control visceral and mesenteric fat accumulation by controlling calorie intake and excreting excess fat through their feces. However, the mechanism of fat-storage homeostasis in S. murinus will be an important subject in our continuing investigation.
Acknowledgment
We thank Mr. Yoshitake Shiraishi and Mr. Tsuneo Nakamura, Department of Functional Anatomy, Kanazawa University Graduate School of Medical Sciences, for technical guidance and support for part of the study; Mr. Shuntaro Kohnomi, Reagent Development Department, AOTECH, Inc., for his contribution to the statistic alanalysis of this research. This study was supported by the Grant for Scientific Research from Faculty of Health Sciences, Tokyo Metropolitan University (No. 280530-1425000) and Grant-in-Aid for Scientific Research from the Ministry of Education, Culture, Sports, Science and Technology of Japan (No. 19K07271).
Author contributions
Zhang M, Ren K and Yi SQ designed the research; Zhang M, Dai Y and Wang Z performed all experiments, collected data and analyzed the data; Terayama H, Sasaki H and Yi SQ performed the statistical analysis; Zhang M wrote the manuscript; Chen J, Yamamoto Y and Yi SQ reviewed the manuscript; all authors approved the final version of the manuscript.
References
1. Menikdiwela KR, Ramalingam L, Allen L, et al. 2019. Angiotensin II Increases Endoplasmic Reticulum Stress in Adipose Tissue and Adipocytes. 9: 8481. Ref.: https://go.nature.com/3dBTf27
2. World health statistics 2018: monitoring health for the SDGs, sustainable development goals. Geneva: World Health Organization; 2018. Licence: CC BY-NC-SA 3.0 IGO. Ref.: https://bit.ly/307bNTX
3. Castaner O, Goday A, Park YM, et al. 2018. The Gut Microbiome Profile in Obesity: A Systematic Review. Int J Endocrinol. 2018: 4095789. Ref.: https://bit.ly/3dMkuXy
4. Thaiss CA. 2018. Microbiome dynamics in obesity. Science. 362: 903-904. Ref.: https://bit.ly/372PZdo
5. Cirulli ET, Guo L, Leon Swisher C, et al. 2019. Profound Perturbation of the Metabolome in Obesity Is Associated with Health Risk. Cell Metab. 29: 488-500. Ref.: https://bit.ly/3gUlVFB
6. Arun G, Rajaram R, Kaleshkumar K, et al. 2019. Synergistic effect of novel chitosan combined metformin drug on streptozotocin-induced diabetes mellitus rat. Int J Biol Macromol. 8130: 37845-37846. Ref.: https://bit.ly/2Y051ww
7. Gallou-Kabani C, Vigé A, Gross MS, et al. 2007. C57BL/6J and A/J mice fed a high-fat diet delineate components of metabolic syndrome. Obesity. 15: 1996-2005. Ref.: https://bit.ly/2U9LjNW
8. Kawai T, Ito T, Ohwada K, et al. 2006. Hereditary postprandial hyper triglyceridemic rabbit exhibits insulin resistance and central obesity: a novel model of metabolic syndrome. Arterioscler Thromb Vasc Biol. 26: 2752-2757. Ref.: https://bit.ly/2UddNGj
9. Sugimura N, Otani K, Watanabe T, et al. 2019. High-fat diet-mediated dysbiosis exacerbates NSAID-induced small intestinal damage through the induction of interleukin-17A. Sci Rep. 9: 16796. Ref.: https://go.nature.com/2XwM8Cq
10. Yi SQ, Ohta T, Miwa K, et al. 2005. Surgical anatomy of the innervation of the major duodenal papilla in human and Suncus, from the perspective of preserving innervation in organ-saving procedures. Pancreas. 30: 211-217. Ref.: https://bit.ly/2Mv8huH
11. Yi SQ, Ohta T, Tsuchida A, et al. 2007. Surgical anatomy of innervation of the gallbladder in humans and Suncus murinus with special reference to morphological understanding of gallstone formation after gastrectomy. World J Gastroenterol. 13: 2066-2071. Ref.: https://bit.ly/30gIXAJ
12. Yi SQ, Shimokawa T, Akita K, et al. 2003. Anatomical study of the pancreas in the house musk shrew (Suncus murinus), with special reference to the blood supply and innervation. Anat Rec A Discov Mol Cell Evol Biol. 273: 630-635. Ref.: https://bit.ly/36ZV9aj
13. Hutterer R, Schneider FW, Pérez N, et al. 1993. Influence of lipid composition and membrane curvature on fluorescence and solvent relaxation kinetics in unilamellar vesicles. J Fluoresc. 3: 257-259. Ref.: https://bit.ly/3ePwesD
14. Rogatcheva MB, Oda S, Axenovich TI, et al. 1998. Chromosomal segregation and fertility in Robertsonian chromosomal heterozygotes of the house musk shrew (Suncus murinus, Insectivora, Soricidae). Heredity (Edinb). 81: 335-341. Ref.: https://go.nature.com/3711t12
15. Dudley ES, Grunden BK, Crocker C, et al. 2013. Incidence of dental lesions in musk shrews (Suncus murinus) and their association with sex, age, body weight and diet. Lab Anim (NY). 42: 422-426. Ref.: https://go.nature.com/3743bim
16. Saga S, Sasaki N, Arai T. 2018. Molecular identification, characterization, and structure analysis of house musk shrew (Suncus murinus) leptin. J Adv Vet Anim Res. 6: 1-8. Ref.: https://www.ncbi.nlm.nih.gov/pmc/articles/PMC6702923/
17. Oda S, Kondo K. 1976. Progress in domestication of Suncus murinus riukjuanus for experiments. Honyurui Kagaku (Mammalian Science). 33: 13-30. Ref.: https://bit.ly/2Y1cfQR
18. Oda S, Kondo K. 1977. Usefulness of wild insectivores as laboratory animals. Exp Anim. 26: 273-280. Ref.: https://bit.ly/3gVgxSz
19. Suzuki D, Murata Y, Oda S. 2006. Change in Ucp1 mRNA expression following long-term cold exposure under normal or high-fat diet regimes in the cold-intolerant mammal, S. murinus. Exp Anim. 55: 467-471. Ref.: https://bit.ly/3eSTztv
20. Suzuki D, Murata Y, Oda S. 2006. Cloning of putative uncoupling protein 1 cDNA in a cold-intolerant mammal, the house musk shrew (Suncus murinus). Zoolog Sci. 23: 1009-1015. Ref.: https://bit.ly/3cGGodO
21. Suzuki D, Murata Y, Oda S. 2007. Changes in Ucp1, D2 (Dio2) and Glut4 (Slc2a4)
mRNA expression in response to short-term cold exposure in the house musk shrew (Suncus murinus). Exp Anim. 56: 279-288. Ref.: https://bit.ly/3gXuoaU
22. Dai Y, Ren K, Kurosawa K, et al. 2019. The distribution of nerves supplying the testis, epididymis and accessory sex glands of Suncus murinus. Anat Sci Int. 94: 128-135. Ref.: https://bit.ly/2MBIIb3
23. Li J, Yi SQ, Terayama H, et al. 2010. Distribution of ghrelin cells in stomach and the effect of ghrelin intraperitoneal administration in house musk shrew (Suncus murinus). Neuro Endocrinol Lett. 31: 406-412. Ref.: https://bit.ly/3cAQiO3
24. Tsutsui C, Kajihara K, Yanaka T, et al. 2009. House musk shrew (Suncus murinus, order: Insectivora) as a new model animal for motilin study. Peptides. 30: 318-329. Ref.: https://bit.ly/3dBuFyb
25. Yi SQ, Akita K, Ohta T, et al. 2004. Cellular localization of endocrine cells in the adult pancreas of the house musk shrew, Suncus murinus: a comparative immunocy tochemical study. Gen Comp Endocrinol. 136: 162-170. Ref.: https://bit.ly/307dXD3
26. Yi SQ, Li J, Qu N, et al. 2010. House musk shrew, Suncus murinus: a novel and natural obesity-resistant animal model. Obes Metab. 6: 22-28. Ref.: https://bit.ly/3dBuKSv
27. Yi SQ, Li J, Yamaguchi T, et al. 2011. Immunolocalization of the PP family and its receptors in the gastrointestinal tract of house musk shrew, Suncus murinus. Neuro Endocrinol Lett. 32: 212-219. Ref.: https://bit.ly/3gViBd8
28. Yi SQ, Ren K, Kinoshita M, et al. 2016. Innervation of extrahepatic biliary tract, with special reference to the direct bidirectional neural connections of the gallbladder, sphincter of Oddi and duodenum in Suncus murinus, in whole-mount immunohistochemical study. Anat Histol Embryol. 45: 184-188. Ref.: https://bit.ly/309ZYfJ
29. Yi SQ, Ru F, Ohta T, et al. 2006. Surgical anatomy of the innervation of pylorus in human and Suncus murinus, in relation to surgical technique for pylorus-preserving pancreaticoduodenectomy. World J Gastroenterol. 12: 2209-2216. Ref.: https://www.ncbi.nlm.nih.gov/pmc/articles/PMC4087648/
30. Bray GA. 1984. Integration of energy intake and expenditure in animals and man: the autonomic and adrenal hypothesis. Clin Endocrinol Metab. 13: 521-546. Ref.: https://bit.ly/36ZWMVt
31. Liu L, Zhao SP, Wen T, et al. 2008. Postprandial hypertriglyceridemia associated with inflammatory response and procoagulant state after a high-fat meal in hypertensive patients. Coron Artery Dis. 19: 145-151. Ref.: https://bit.ly/3eVCr6v
32. Karlsson M, Mårild S, Brandberg J, et al. 2006. Serum phospholipid fatty acids, adipose tissue, and metabolic markers in obese adolescents. Obesity (Silver Spring). 14: 1931-1939. Ref.: https://bit.ly/2BBM77N
33. Li C, Cui LH. 2013. Relationship among intestinal flora, high-fat diets, and hyperlipidemia. Shijie Huaren Xiaohua Zazhi. 21: 1273-1277. Ref.: https://bit.ly/2XwOlhc
34. Seo CW, Um IC, Rico CW, et al. 2011. Antihyperlipidemic and body fat-lowering effects of silk proteins with different fibroin/sericin compositions in mice fed with high fat diet. J Agric Food Chem. 59: 4192-4197. Ref.: https://bit.ly/2Y6fOp5