
-
Mail us:
editor@raftpubs.org
- ISSN : 2583-1534
Indexing & Abstracting
Full Text
Research ArticleDOI Number : 10.36811/ojrmi.2020.110008Article Views : 8Article Downloads : 0
The value of three-dimensional MR imaging in displaying triangular fibrocartilage complex
Muhebullah Alizada1*, Boyu Chen1, Guoguang Fan1 and Mirwais Alizada2
1Department of Radiology, The First Affiliated Hospital of China Medical University, #155, Nanjing North St., Heping Dist., Shenyang, Liaoning 110001, China
2Department of Orthopedic, The First Affiliated Hospital of Zhengzhou University, No.1, Jianshe East Rd. Zhengzhou, Henan, 450052, China
*Corresponding Author: Dr Muhebullah Alizada, Resident/ First Affiliated Hospital of China Medical University,#155, Nanjing North St., Heping Dist., Shenyang, Liaoning 110001, China; Email: muhebullahalizada@hotmail.com
Article Information
Aritcle Type: Research Article
Citation: Muhebullah Alizada, Boyu Chen, Guoguang Fan, Mirwais Alizada. 2020. The value of three-dimensional MR imaging in displaying triangular fibrocartilage complex. O J Radio Med Img. 3: 21-28.
Copyright: This is an open-access article distributed under the terms of the Creative Commons Attribution License, which permits unrestricted use, distribution, and reproduction in any medium, provided the original author and source are credited. Copyright © 2020; Muhebullah Alizada
Publication history:
Received date: 23 May, 2020Accepted date: 01 June, 2020
Published date: 03 June, 2020
Abstract
Introduction: Triangular fibrocartilage complex (TFCC) plays a vital role in stabilizing the ulnar side of the wrist, whose injury potentially causes ulnar sided wrist pain. Conventional 2D-MR sequences have limitations in exhibiting the fine anatomy of TFCC. A three-dimensional fast spin-echo pulse sequence with parallel imaging and extended echo train acquisition (3D-FSE-CUBE) sequence is a sensitive imaging technique for ligaments and articular cartilage. It can completely replace 2D FSE in clinical application to complex joint examination, which helps improve the accuracy of diagnosis. The number of researches on the wrist joint is minimal. Therefore, we applied the 3D cube sequence to estimate its diagnostic significance in the wrist joint.
Materials and Methods: Seventeen adult healthy volunteers (11 males and six females) were enrolled, which in total makes thirty-four wrist joints, aged 22-42 years old (mean±SD; 29.00±4.42). We utilized conventional MRI and 3D cube sequences to examine all of these volunteers’ wrist joints, measure the signal-to-noise ratio (SNR) of each sequence, and record the display rate of TFCC structures in each sequence. We compared SNR among the various sequences by using a paired t-test, and the difference was statistically significant with P≤0.05.
Results: The 3D Cube-T2 sequence has a higher display rate compared to the 2D-FSE-T2 for displaying ulnolunate (UL), ulnotriquetral (UT) and Ulnar collateral ligaments. The 3D-Cube-T1 sequence has a higher display rate compared to the 2D-FSE-T1 sequence for UL, UT, and Ulnar collateral ligaments. The SNR of 3D-Cube-T1 is significantly higher when compared with 2D-FSE-T1 (p=0.00). A significant difference between the SNR of 3D Cube-T2 and 2D-FSE-T2 was not noticed (p=0.56).
Conclusion: Coronal 3D cube sequence has better SNR and a higher TFCC display rate, which can be used as a routine sequence to observe TFCC and its surrounding ligaments.
Keywords: Triangular fibrocartilage complex; 3D-FSE-cube; MRI; Anatomy
Introduction
Triangular fibrocartilage complex (TFCC) is an essential stabilizing structure on the ulnar side of the wrist. Its components include [1,2]: triangular fibrocartilage disc, dorsal and volar distal radioulnar ligaments, ulnotriquetral ligament (UT), ulnolunate (UL)ligament, Ulnar collateral ligament (UCL), meniscus homolog (MH), the extensor carpi ulnaris tendon (ECU) and the sheath of the extensor carpi-ulnaris tendon. Injury of trigonal fibrocartilage complex is the leading cause of ulnar sided wrist pain [3]. The pain and dysfunction of the wrist seriously affect the quality of life of the patients. At present, the gold standard for the diagnosis of TFCC is wrist arthroscopy [4], but its invasive nature limited its popularity. High tissue contrast and multiplanar imaging are some of the essential characteristics of MRI. It is a thriving, noninvasive, and clinically suitable method for assessing cartilage, tendon, and ligament injury [5]. However, currently, some studies have shown that conventional 2D-MR sequences have limitations in displaying the fine anatomy of TFCC. Three-dimensional fast spin-echo pulse sequence with parallel imaging and extended echo train acquisition (3D-FSE-cube) sequence [6]. is a newly developed image technology. It adopts parallel acquisition imaging and extended echo-train acquisition length technology, has SE sequence contrast [7], and dramatically reduces partial volume artifacts through thin-layer volume scanning. In the current imaging of knee joint and ankle joint [8,9], the 3D cube T2WI sequence is very sensitive to the ligaments and articular cartilages. In the clinic, it can completely replace 2D FSE for the examination of complex joints, which is helpful to improve the accuracy of diagnosis. However, there are very few studies in the literature on the wrist joint. The purpose of this study is to compare 3D-FSE-cube T2WI with the traditional 2D-FSE scanning sequence and to investigate the advantages and disadvantages of a 3D scanning sequence in displaying the anatomical details structures of triangular fibrocartilage of the wrist joint, to provide more reliable technical support for MRI clinical diagnosis of the wrist.
Materials and Method
This study was approved by the institutional review committee of the First Affiliated Hospital of China Medical University, Shenyang, Liaoning, P.R. China, and informed consents were taken from all volunteers. From December 2018 to February 2020, seventeen healthy volunteers (eleven males and six females; mean age ± SD, 29 ± 4.5 years; aged from 22 to 42 years) were enrolled in this study. All participants were medical professionals, either resident students or hospital staff. All subjects were thoroughly screened in a structured interview by a radiologic technologist. The exclusion criteria were wrist pain in the past six months, wrist trauma that needed medical intervention, wrist surgery, and fracture, or dislocation of either component of carpal joint such as variations of carpal bones, radius, ulna.
MR imaging protocol
Images of the examinees were obtained utilizing the 3.0T MR imaging (signa pioneer, General Electric (GE) Healthcare, Milwaukee, WI, USA). A 16-channel flex coil was used in both 2D-FSE and 3D cube sequences to scan bilateral wrist joints of all seventeen participants in the conventional coronal plane. We acquired a T2 weighted image (T2WI). All volunteers were placed on the MRI table with a “superman” position (the patient was prone with arm extended over the head). Their forearms were extended and pronated; the back of the hand was fixed with a pressurized sandbag. A cushion pad was placed under the chest and head for extra comfort. We aligned the center of the coil was with the wrist joint and placed it in the isocenter of the imager. In the case of body displacement to the opposite side, the maximum efforts was made to maintain the scanned wrist joint closer to the center of the magnetic field as possible, and the wrist was fixed so that it could not move in the coil. The scanning parameters of all subjects are the same, and the specific MR scanning parameters are as follows; 2D-FSE-T1: TR:510(ms), TE: 16.3/fr, FA: 111 deg, Slices: 3.0(mm), FOV: 20*20cm, Scan time: 1: 35min, 2D-FSE-T2: TR: 1690(ms), TE: 57.3/fr, FA: 111 degree, Slices: 3.0(mm), FOV: 20*20cm, Scan time: 2.19minCube-T1: TR:562(ms), TE: 17.6/fr, FA: 90-degree, Slices: 1.00(mm), FOV: 20*20cm, Scan time: 3:31min; Cube-T2: TR: 2113(ms), TE: 121.4/fr, FA: 90deg., Slices: 1.0(mm), FOV: 20*20cm, Scan time: 3:35min.
Image analysis
After scanning, the images were delivered to the Advantage Windows (functool version 9.3.01, general electric, Milwaukee, USA) workstation of GE company for analysis. Adw4.6 workstation was used for image analysis and review. A region of interest (ROI) was manually defined. We measured three times the signal of the same region of interest (ROI) at the same anatomic level for each sequence and calculated the average value. The average signal intensity of the background noise of the triangular fibrocartilage disc homologs and the artifact-free area medial to the wrist joint was measured. The measurement method is shown in (Figure 1): ROI1: Triangular fibrocartilage homolog. ROI2: The intensity of background noise on the medial side of the wrist of the artifact-free area. The area of ROI was 2mm*2mm. Signal to noise ratio (SNR) was defined as “mean of signal strength of ROI1 / mean of signal strength of ROI2”. Two senior radiologist doctors familiar with the anatomy of TFCC evaluated the anatomic structure of TFCC in 2D and 3D-FSE-cube images and reached a unified conclusion. They calculated the display rate of each anatomical structure.
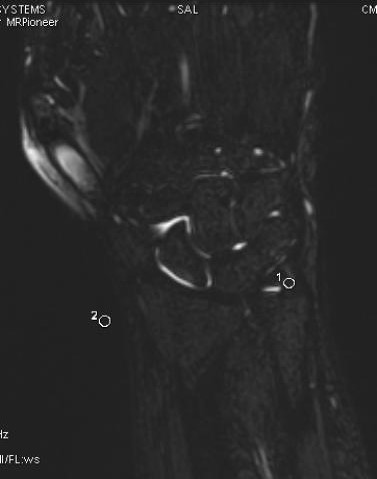
Figure 1: SNR measurement method.
White is region of interest (ROI) area; 1 is triangular fibrocartilage complex (TFCC) signal intensity; 2 is background noise signal intensity; the two ROI sizes are the same.
Statistical analysis
We used SPSS v.19.0 software (Chicago, IL, USA) to analyze the data. The paired sample t-test was used to analyze and compare the SNR differences between the sequences, and the Chi-square test was used to analyze the display rate of 3D-FSE-cube and 2D sequences to show each anatomical structure of TFCC. A p≤0.05 was considered statistically significant in all tests.
SNR of each sequence
The SNR of 3D-Cube-T1 is significantly higher when compared with 2D-FSE-T1 (p<0.05). A significant difference between the SNR of 3D Cube-T2 and 2D-FSE-T2 was not noticed (p>0.05). See Table 1 for specific values.
|
Table 1: Analysis of TFCC SNR difference between 3D cube sequence and 2D-FSE sequence. |
||||||||||
|
Sequence |
Mean |
SD |
T value |
P value |
Sample size N |
|||||
|
3D-CubeT2
|
|
1.87 |
|
0.31 |
|
4.74 |
|
0.56 |
|
34 |
|
2D-FSE-T2 |
|
1.52 |
|
0.33 |
|
|
|
|
|
|
|
3D-Cube T1 |
|
12.48 |
|
3.36 |
|
12.2 |
|
0.000 |
|
34 |
|
2D-FSE-T1 |
|
5.39 |
|
1.57 |
|
|
|
|
|
|
TFCC display rates of different anatomical structures in different sequences:
Triangular fibrocartilage disc: 3D-Cube-T2100%, 34/34); FSE-T2100% (34/34); 3D-Cube-T1100% (34/34); FSE-T1100% (34/34).
Dorsal and volar distal radioulnar ligaments:3D-Cube-T2100%, 34/34??FSE-T2100% (34/34); 3D-Cube-T1100% (34/34); FSE-T1100% (34/34).
Ulnolunate (UL) ligament: 3D-Cube-T2 97.1% (33/34)?FSE-T2 5.9% (2/34); 3D-Cube-T1 82.4% (28/34); FSE-T1 0% (0/34).
Ulnotriquetral ligament (UT): 3D-Cube-T2 100% (34/34); FSE-T2 88.2% (30/34); 3D-Cube-T1 88.2% (30/34); FSE-T1 85.7% (27/34).
Ulnar collateral ligament: 3D-Cube-T2 100% (34/34) FSE-T2 85.3% (29/34) 3D-Cube-T1 94.1% (32/34) FSE-T1 85.3% (29/34).
The sheath of the extensor carpi-ulnaris tendon and meniscus homolog (MH): 3D-Cube-T2 100%, 34/34); FSE-T2 100% (34/34) 3D-Cube-T1 100% (34/34) FSE-T1 97.1% (33/34).
The 3D Cube-T2 sequence has a higher display rate compared to 2D-FSE-T2 for displaying of ulnolunate (UL), ulnotriquetral (UT), and ulnarcollateral ligaments (UCL). The 3D-Cube-T1 sequence has a higher display rate compared to the 2D-FSE-T1 sequence for UL, UT, and Ulnar collateral ligaments. As shown in figure2.
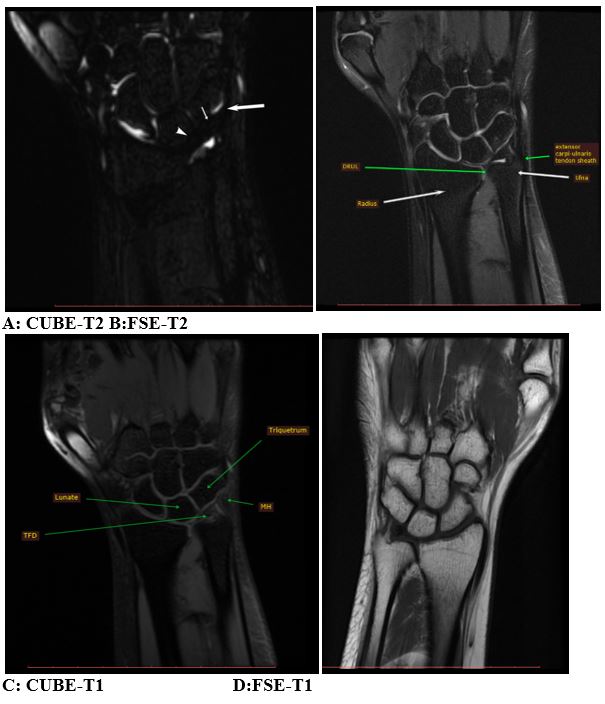
Figure 2: shows the anatomical structures of TFF.
A: White narrow arrow  demonstrates UL, white arrow
  head demonstrates UT, thick white arrow demonstrates UCL
UL: Ulnolunate; UT: ulnotriquetral; UCL: ulnarcollateral ligaments
Discussion
The wrist joint is a biaxial, ellipsoid-type joint that bridges the hand to the forearm. Its functional state directly affects the function of the hand, especially the fine activity of hand. Wrist joint pain and dysfunction seriously affect the quality of life of the patient. Presently the gold standard for the diagnosis and treatment of TFCC injury is thought to be wrist arthroscopy [10]. This modality diagnoses and treats the injuries of articular cartilage and ligaments via direct vision. Still, the lack of experience of the clinical doctors of this technique and leads to less usage of wrist arthroscopy in China. Moreover, its invasive nature is another obstacle to clinical application.
The high tissue contrast, multiplanar imaging, and non-invasiveness of MRI made it a practical and clinically useful modality for the evaluation of cartilage, tendon, and ligament injury. [11-14] It is extensively utilized to diagnose and assess of carpal diseases due to its high diagnostic sensitivity and accuracy. [15] The wrist joint has a complex structure with short ligaments that run in different directions. The main difficulties for the conventional 2D sequence to clearly visualize TFCC are the inherent pitfalls of the conventional 2D sequence, such as the layer thickness, the layer spacing, and the partial volume effect as well as the complexity of the TFCC with its surrounding attached ligaments. Three-dimensional volume scanning technology overcomes these limitations [16-21]. There is no layer thickness and layer spacing limitations in 3D cube scanning. It can maintain the same resolution within and between layers, avoid partial volume artifacts. It can carry out image reconstruction in any direction after a single scan, can realize multi plane reconstruction after a single scan, and facilitate the accurate evaluation of joint ligament, tendon, and cartilage. The rapid advancement of imaging modalities, software development, and application of many novel imaging sequences significantly shortened the scanning time of MRI. The significant shortage in the scanning time of the MRI overcomes the long time and low SNR limitations of previous three-dimensional sequences, and make it possible to apply long time-consuming 3D sequences in the clinical practice. Three-dimensional fast spin-echo pulse sequence with parallel imaging and extended echo train acquisition(3D-FSE-CUBE) sequence [6] is a newly developed image technology. It adopts parallel acquisition imaging and extended echo train length, has SE sequence contrast, and dramatically reduces partial volume effect artifacts through thin-layer volume scanning. In this study, the SNR of 3D-CUBE-T1 was significantly higher than that of 2D-FSE-T1, 3D-CUBE-T2 and 2D-FSE-T2 were not significantly different. Preliminary studies in China and abroad have applied this sequence to ankle joint examination [7,20,22], and have confirmed this sequence’s superiority. It can provide information that cannot be obtained by conventional MRI examination, and its SNR is not lower than that of the 2D FSE sequence [23,24], which is consistent with our research results. Furthermore, KJ et al. used 1.5T MRI to examine the wrist joint 3D-CUBE in healthy volunteers, and the SNR of the image was not lower than that of the conventional 2D-FSE sequence [25]. Nevertheless, we found that the 3D-CUBE-T2 sequence has a higher display rate for UL, UT, and Ulnar collateral ligaments than that of 2D-FSE-T2. The 3D CUBE-T1 sequence has a higher display rate for UT, UL, and UCL than the 2D-FSE-T1 sequence, which shows the superiority of the 3D sequence. Moreover, the scanning time is one of the critical issues for the application of 3D scanning technology. In this study, the scanning time of 2D-FSE-T1 is 1:35min, that of 2D-FSE-T2 is 2.19min, that of CUBE-T1 is 3:31min, and that of CUBE-T2 is 3:35min. Considering the time consumption for the multi-directional scanning of the 2D-FSEsequences, and that of multi-direction all reconstruction after every single scanning of3D sequences, the total examination time is not significantly prolonged. MRI is the most effective noninvasive examination method for a TFCC injury. It has the characteristics of high-level multiplanar imaging with soft tissue resolution. Only by mastering the normal anatomical MR manifestations of TFCC, we can make a correct diagnosis of its injury. The three-dimensional sequence improves spatial resolution. Only by learning the three-dimensional MR sequence of healthy TFCC structure, we can easily detect even a slight injury of TFCC. Like every other study, this work also has several limitations. First of all, there are fewer samples in this study. Larger sample size will help to increase the accuracy of the results further. Secondly, to improve the subjects' compliance, the 3D cube sequence was selected in this study, so we needed to compare the axial view of the MR image of the writ joint between different 3D sequences. Further research is significantly crucial for optimizing MRI parameters and reducing the scanning time as much as possible.
Conclusion
In this study, the coronal view of 2D-FSE and 3D CUBE FSE sequences were compared and found out that MRI is an advantageous diagnostic method to find out the vital index of TFCC injury noninvasively. The coronal 3D cube sequence has good SNR and a higher TFCC display rate. It can be used as a routine sequence to observe TFCC and its surrounding ligaments, which provides a sufficient basis for clinical diagnosis, a broad clinical application prospect.
Abbreviations
TFCC Triangular Fibrocartilage Complex
3D-FSE-CUBE Three-Dimensional Fast Spin-Echo Pulse Sequence with parallel imaging and extended echo train acquisition
FSE Fast Spin-Echo Pulse Sequence
MRI Magnetic Resonance Imaging
SNR Signal-to-Night Ratio
References
1. Fischer J, Thompson NW, Harrison JW. 2014. Triangular Fibrocartilage Complex Lesions-A Classification, in Classic Papers in Orthopaedics. Springer. 371-372. Ref.: https://bit.ly/3chrTwC
2. Nakamura T, Yabe Y. 2000. Histological anatomy of the triangular fibrocartilage complex of the human wrist. Annals of Anatomy-Anatomischer Anzeiger. 182: 567-572. Ref.: https://bit.ly/36Eogjj
3. Sachar K. 2008. Ulnar-sided wrist pain: evaluation and treatment of triangular fibrocartilage complex tears, ulnocarpal impaction syndrome, and lunotriquetral ligament tears. J Hand Surg Am. 33: 1669-1679. Ref.: https://bit.ly/2XagFFQ
4. Slutsky DJ, Nagle DJ. 2008. Wrist arthroscopy: current concepts. J Hand Surg Am. 33: 1228-1244. Ref.: https://bit.ly/3d9jgpb
5. Yoshioka H, Burns JE. 2012. Magnetic resonance imaging of triangular fibrocartilage. J Magn Reson Imaging. 35: 764-778. Ref.: https://bit.ly/2AmPwa0
6. Busse RF, Hari Hariharan, Anthony Vu, et al. 2006. Fast spin echo sequences with very long echo trains: design of variable refocusing flip angle schedules and generation of clinical T2 contrast. Magn Reson Med. 55: 1030-1037. Ref.: https://bit.ly/2Mbf4te
7. Bauer JS, Banerjee S, Henning TD, et al. 2007. Fast high-spatial-resolution MRI of the ankle with parallel imaging using GRAPPA at 3 T. AJR Am J Roentgenol. 189: 240-245. Ref.: https://bit.ly/3cefIAT
8. Application of MR 3D FSE CUBE sequence in evaluation of anatomy of ligament ankle joint of healthy volunteers.pdf.
9. Ankle Isotropic MR Imaging with.pdf.
10. Boer BC, Vestering M, van Raak SM, et al. 2018. MR arthrography is slightly more accurate than conventional MRI in detecting TFCC lesions of the wrist. Eur J Orthop Surg Traumatol. 28: 1549-1553. Ref.: https://bit.ly/2ZOuviU
11. Elsner KS, Milbich J, Giebel G, et al. 1996. Magnetic resonance tomography study of ankle joint fractures. A prospective pathologic-anatomic study. Unfallchirurg. 99: 581-586. Ref.: https://bit.ly/2XIZHgL
12. The value of MRI in ankle cartilage injury.pdf.
13. Nacey NC, Geeslin MG, Miller GW, et al. 2017. Magnetic resonance imaging of the knee: An overview and update of conventional and state of the art imaging. J Magn Reson Imaging. 45: 1257-1275. Ref.: https://bit.ly/36FZKxZ
14. Comparative analysis of 3D-SPACE and conventional 2D-FS-TSE-PDWI sequences in the diagnosis of cruciate ligament and cartilage injury of knee.pdf.
15. Zlatkin MB, Rosner J. 2006. MR imaging of ligaments and triangular fibrocartilage complex of the wrist. Radiol Clin North Am. 44: 595-623. Ref.: https://bit.ly/2XdsZ8w
16. Lee YH, Choi YR, Kim S, et al. 2013. Intrinsic ligament and triangular fibrocartilage complex (TFCC) tears of the wrist: comparison of isovolumetric 3D-THRIVE sequence MR arthrography and conventional MR image at 3 T. Magn Reson Imaging. 31: 221-226. Ref.: https://bit.ly/2XBSpeS
17. Gold GE, Busse RF, Beehler C, et al. 2007. Isotropic MRI of the knee with 3D fast spin-echo extended echo-train acquisition (XETA): initial experience. American Journal of Roentgenology. 188: 1287-1293. Ref.: https://bit.ly/2MaHG5K
18. Notohamiprodjo M, Kuschel B, Horng A, et al. 2012. 3D-MRI of the ankle with optimized 3D-SPACE. Invest Radiol. 47: 231-239. Ref.: https://bit.ly/3etNKlZ
19. CHEN Wen Ping ZM. 2012. Application of MR 3D-TSE(SPACE) sequence in evaluation of anatomy of the ankle joint of healthy volunteers.pdf. china. 580-584.
20. Stevens KJ, Busse RF, Han E, et al. 2008. Ankle: isotropic MR imaging with 3D-FSE-cube--initial experience in healthy volunteers. Radiology. 249: 1026-1033. Ref.: https://bit.ly/2XJ3WJc
21. Zhang H, Xia TJ, Bai RJ, et al. 2018. The classification and MR imaging of scapholunate ligament injuries. Zhonghua Yi Xue Za Zhi. 98: 3153-3157. Ref.: https://bit.ly/3gxgDj2
22. Yao L, Pitts JT, Thomasson D. 2007. Isotropic 3D fast spin-echo with proton-density-like contrast: a comprehensive approach to musculoskeletal MRI. AJR Am J Roentgenol. 188: 199-201. Ref.: https://bit.ly/2zJkwAN
23. Bae WC, Ruangchaijatuporn T, Chung CB. 2017. New Techniques in MR Imaging of the Ankle and Foot. Magn Reson Imaging Clin N Am. 25: 211-225. Ref.: https://bit.ly/2TP8lcF
24. Gold GE, et al. 2007. Isotropic MRI of the knee with 3D fast spin-echo extended echo-train acquisition (XETA): initial experience. AJR Am J Roentgenol. 188: 1287-1293. Ref.: https://bit.ly/2TP8lcF
Stevens KJ, Wallace CG, Chen W, et al. 2011. Imaging of the wrist at 1.5 Tesla using isotropic three-dimensional fast spin echo cube. J Magn Reson Imaging. 33: 908-915. Ref.: https://bit.ly/2ZLFNEy