
-
Mail us:
editor@raftpubs.org
- ISSN : 2583-1534
Indexing & Abstracting
Full Text
Research ArticleDOI Number : 10.36811/ojrmi.2021.110014Article Views : 188Article Downloads : 97
Improved visualization of Liver Metastases Adjacent to Vessels using Hepatobiliary Phase Gadoxetic-acid-enhanced Single Shot Inversion-Recovery Gradient-Echo (IRGRE) MR Imaging
Arthur J Pesch MD1,*, James Patrie MS2, John P Mugler, III PhD1 and Eduard E de Lange MD1
1Department of Radiology and Medical Imaging, University of Virginia Health Sciences System, USA
2Department of Public Health Science, University of Virginia Health Sciences System, USA
*Corresponding Author: Arthur J. Pesch, MD, Department of Radiology and Medical Imaging, University of Virginia Health Sciences System, PO Box 800170,1560 Lee Street, Charlottesville, VA 22908, USA, Fax: (434) 982 1618; Tel: (434) 982 6018; Email: eed6s@virginia.edu
Article Information
Aritcle Type: Research Article
Citation: Arthur J Pesch, James Patrie MS, John P Mugler. 2021. Improved visualization of Liver Metastases Adjacent to Vessels using Hepatobiliary Phase Gadoxetic-acid-enhanced Single Shot Inversion-Recovery Gradient-Echo (IRGRE) MR Imaging. O J Radio Med Img. 4: 26-38.
Copyright: This is an open-access article distributed under the terms of the Creative Commons Attribution License, which permits unrestricted use, distribution, and reproduction in any medium, provided the original author and source are credited. Copyright © 2021; Arthur J Pesch
Publication history:
Received date: 09 February, 2021Accepted date: 13 February, 2021
Published date: 15 February, 2021
Abstract
Objectives: To quantitatively compare contrast differences between liver metastases and vessels on Hepatobiliary Phase (HP) gadoxetic-acid-enhanced 2-Dimensional (2D) single-shot Inversion Recovery Gradient-Echo (IRGRE) and 3D Fat Saturated GRE (FSGRE) magnetic resonance images.
Methods: The study included 55 consecutive patients who had HP FSGRE and IRGRE (39 at 1.5T, 16 at 3T) for liver metastases evaluation obtained 20 minutes after gadoxetic-acid administration. Thirty-eight patients had metastases (23 at 1.5T, 15 at 3T). Regions of interest were drawn measuring signal intensity (SI) of the largest lesion, normal liver, inferior vena cava, and background noise. Signal-to-noise (SNR) and contrast-to-noise ratio (CNR), respectively, were calculated as SI divided by standard deviation (SD) of background noise, and (S1-S2)/SD, where S1 and S2 represented SI for tissue 1 and tissue 2. Statistical analysis was via the Wilcoxon Sign Rank test.
Results: Median liver-SNR for all 55 cases was greater for FSGRE than for IRGRE, as was lesion-SNR in the 38 with lesions (p<0.05). Vessel-SNR was greater for IRGRE than for FSGRE at 3T (p<0.05), with no difference between techniques at 1.5T (p>0.05). Median lesion/vessel contrast and CNR for the 38 cases with metastases at 1.5T and the 15 at 3T were, in absolute value, greater for IRGRE than for FSGRE (p<0.05). While both techniques yielded high lesion-liver contrast and CNR, only IRGRE provided consistently high lesion-vessel contrast and CNR (p<0.05).
Conclusion: Hepatobiliary-phase contrast difference between liver metastases and vessels was significantly and substantially greater for IRGRE than for FSGRE, potentially facilitating improved lesion detection using IRGRE.
Introduction
Hepatobiliary phase (HP) MR images acquired at approximately 20 minutes following intravenous administration of a hepatocyte-specific contrast agent, such as gadoxetic acid (gadoxetic disodium), have been shown to aid in lesion detection in patients with cancer evaluated for liver metastases [1-8]. Image acquisition is typically done with a 3-dimensional (3D) fat-saturated gradient-echo (FSGRE) technique. At HP, metastases display relatively low signal intensity (SI) compared to the surrounding high SI contrast-agent-containing liver parenchyma [9]. However, since at HP the intravascular component of the agent is mostly cleared by the kidneys, the intrahepatic vessels also display low SI, similar to that of metastases. Consequently, lesions adjacent to vessels may be difficult to detect, particularly when small [6,10,11]. To increase lesion/vessel contrast and improve lesion detection, some researchers have administered an additional, gadolinium-based intravascular contrast agent [12,13]. Inversion-recovery gradient-echo (IRGRE) imaging, also known as TurboFLASH (Siemens Healthineers), IR FSPGR (General Electric Healthcare), or T1-TFE (Philips Healthcare), is a 2-dimensional (2D) single-shot gradient-echo technique that allows rapid acquisition of T1-weighted images during a single breath hold [14-16]. When a slice-selective IR pulse is used [14-16], the vessels display high SI from the inflow of unsaturated blood [17]. Since, for the GRE component of the pulse sequence, a relatively short repetition time (TR) and low flip angle are typically used, the acquisition time per slice is short (~1 second) and images with relatively low signal-to-noise ratio (SNR) are obtained. When a hepatocyte-specific agent is used, however, the SI of liver parenchyma is substantially increased on HP images, and low SI metastases are easily distinguished from the high SI vessels because of increased lesion/vessel contrast. The purpose of this study was to quantitatively compare differences in contrast between liver metastases and vessels on HP gadoxetic-acid-enhanced 2D IRGRE and 3D FSGRE images in order to assess the potential of HP IRGRE for differentiating metastases from vessels.
Methods
Patients and imaging
This retrospective study was approved by our institutional review board which waived the requirement for written consent allowing review of images obtained in 55 consecutive patients referred for liver metastasis MR evaluation with a hepatocyte-specific contrast agent. Thirty-nine were imaged at 1.5T, and 16 at 3.0T. Liver metastases were present in 38/55 patients [men (n=13), women (n=25), age range 33-88 years (mean age 61 ± 12 years)], with the diagnosis established histologically (biopsy n=19; surgery n=10), and/or from sequential imaging (n=9) showing multiple new lesions in a patient with known malignancy, interval enlargement of earlier diagnosed lesions, or decrease in lesion size with treatment. The primary malignancy in the 38 patients included neuroendocrine tumor (n=15), colon cancer (n=7), melanoma (n=5), and other (n=11). In 23/38 patients with metastases imaging was at 1.5T and in 15 at 3.0T. All scanners were from a single manufacturer (Siemens Healthineers). Selection of the scanner varied based on availability as determined by our departmental schedulers. All patients were imaged per our routine protocol for assessing hepatic metastases, and included axial breath-hold FSGRE and IRGRE images obtained 20 minutes after intravenous administration of 0.1 mL/kg body weight gadoxetic acid (Eovist Injection®, Bayer) [18]. In 18 cases IRGRE images were acquired immediately before FSGRE, and in 37 immediately after.
MR pulse sequences and parameters
FSGRE: The manufacturer’s standard 3D breath-hold technique [Volumetric Interpolated Breath-hold Examination (VIBE®) [19], Siemens Healthineers] was used. Imaging parameters at 1.5T included: TR/TE 4.1-4.9/1.9-2.4 ms, flip angle () 10°-12°, field-of-view (FOV) 340-360 x 230-340 mm2, slice thickness 2.6-3.4 mm interpolated to 2.0 mm, matrix 256-288 x 130-190, slice number 96-112, and parallel imaging acceleration factor 2. Imaging parameters at 3T included: TR/TE 4.0-4.6/1.3-2.0 ms, 9°, FOV 380 x 280-310 mm2, slice thickness 3.1-4.0 mm interpolated to 2.0 mm, matrix 320 x 170-180, slice number 88-128, and parallel imaging acceleration factor 2 or 4.
IRGRE: This pulse sequence is characterized by two distinct components. The first component is a 180° (inversion recovery) radiofrequency pulse followed by a time delay (TI) that “prepares” the magnetization, thereby creating the dominant image contrast. This preparation is followed by the second component, a rapid single-slice 2D-GRE pulse sequence that acquires the image data. Because the GRE sequence uses a short TR and TE, and a low flip angle, it alone would generate an image with relatively low contrast between tissues as differences in SI are predominantly determined by proton density differences, with relatively weak T1 weighting. When the GRE sequence is preceded by the inversion pulse, however, the contrast becomes strongly T1-weighted. Further, by using a slice-selective inversion preparation pulse, the vessels display high SI resulting from the inflow of unsaturated blood during TI [17]. The time delay TI, or inversion time, between the inversion pulse and acquisition of the central k-space lines of the GRE pulse sequence is selected to obtain the desired image contrast. We prefer a TI that results in the central k-space data of the GRE sequence being acquired when the longitudinal magnetization corresponding to hemangiomas crosses the transverse plane. As a result, the SI of these lesions is nulled and they appear dark on the images [15]. The GRE pulse sequence used radiofrequency spoiling of residual transverse magnetization (e.g., fast low-angle shot [FLASH]) and a sequential phase-encoding order, with all phase-encoding steps acquired after one inversion pulse. Imaging parameters at 1.5T included: TR/TE/TI 9/4.4-4.7/700 ms, 10°-15°, FOV 340-400 x 260-360 mm2, slice thickness 4 mm, matrix 256 x 150-210, slice number 41-45, interslice gap 20%-30% (0.8-1.2 mm), and time between consecutive slices 1310-1370 ms. Imaging parameters at 3T included: TR/TE/TI 5.1-5.8/2.4/900 ms, 15°, FOV 360-400 x 290-340 mm2, slice thickness 4 mm, matrix 320 x 190-200, slice number 42-54, interslice gap 20% (0.8 mm), and time between consecutive slices 1470-1500 ms.
Image analysis
Regions of interest were drawn in the HP FSGRE and IRGRE images to measure the SI of the largest lesion in the 38 cases with lesions, and, in all 55 cases, that of the normal liver tissue (while excluding major intrahepatic vessels), the inferior vena cava (representative of vessels), and the background noise with avoidance of any obvious motion artifacts. The SNR was calculated as the SI divided by the standard deviation (SD) of the background noise. Contrast was calculated using the formula (S1-S2)/S2, where S1 and S2 represented the SIs for tissue 1 and tissue 2 (e.g., lesion and normal liver), respectively. Contrast-to-noise ratio (CNR) was calculated using the formula (S1-S2)/SD. Contrast and CNR values were expressed in the absolute value units (i.e. as a positive number).
Statistical Methods
Descriptive summaries: The empirical SNR, contrast and CNR measurements from HP IRGRE and FSGRE were summarized by the median and the interquartile range (IQR) of the empirical distribution. These two non-parametric rank-based summary measures were selected because, irrespective of the shape of underlying measurement distribution, the median of the distribution is a reliable (i.e. robust) estimator for central location, and the IQR of the distribution is a reliable estimator for the measurement dispersion around the central location of the distribution. By definition, the IQR is the range of values between the 1st quartile (i.e. 25th percentile) and 3rd quartile (i.e. 75th percentile) of the measurement distribution.
Imaging comparisons: HP IRGRE versus FSGRE comparisons of SNR, contrast and CNR, were conducted using the Wilcoxon Signed Rank test; a robust non-parametric test for paired data. A two-sided p ≤ 0.05 decision rule was established a-priori as the null hypothesis rejection criterion for all between-imaging modality comparisons.
Statistical Software: The software of Splus, Spotfire version 8.2 (TIBCO Inc., Palo Alto, CA), was used to conduct the non-parametric statistical analyses.
Results
Signal-to-Noise Ratio (Table 1): Median liver SNR for all 39 cases imaged at 1.5T and all 16 imaged at 3T was significantly greater for FSGRE than for IRGRE, which was also the case for lesion SNR in the 38 cases with lesions (p<0.05). Median vessel SNR was significantly greater for IRGRE than for FSGRE at 3T (p<0.05), while there was no substantial difference at 1.5T (p>0.05). Contrast (Table 2): Median lesion/vessel contrast for the 23 cases imaged at 1.5T and the 15 at 3T was, in absolute value, significantly greater for IRGRE than for FSGRE (p<0.05). While both IRGRE and FSGRE yielded high contrast for lesions compared to normal liver, only IRGRE provided consistently high contrast for lesions compared to vessels, which was also significantly greater than that for FSGRE (p<0.05). Contrast-to-Noise Ratio (Table 3): Median lesion/vessel CNR for the 23 cases imaged at 1.5T and the 15 at 3T was, in absolute value, significantly greater for IRGRE than for FSGRE, while the median lesion/liver CNR for these cases was significantly greater for FSGRE than for IRGRE (p<0.05). While both IRGRE and FSGRE yielded high CNR for lesions compared to liver, only IRGRE provided consistently high CNR for lesions compared to vessels, which was also significantly greater than that for FSGRE (p<0.05).
|
Table 1: Signal-to-noise ratio (SNR) empirical distributions summarized by the median and the interquartile range (IQR) of the distributions. |
|||||
|
Tissue |
Number of Cases |
Field strength |
IRGRE |
FSGRE |
P-value |
|
Median |
Median |
||||
|
[IQR] |
[IQR] |
||||
|
Normal liver |
39 |
1.5T |
50.7 [42.6, 82.0] |
137.6 [111.5, 227.0] |
<0.001 |
|
16 |
3T |
89.9 [69.8, 96.7] |
141.3 [111.0, 161.7] |
<0.001 |
|
|
|
|
|
|
|
|
|
Lesion |
23 |
1.5T |
25.2 [19.1, 36.0] |
81.8 [62.8, 116.7] |
<0.001 |
|
15 |
3T |
35.8 [30.2, 53.6] |
75.2 [61.8, 95.2] |
0.001 |
|
|
|
|
|
|
|
|
|
Vessel |
39 |
1.5T |
86.5 [56.4, 104.5] |
88.3 [69.9, 128.8] |
0.197 |
|
16 |
3T |
180.8 [153.1, 250.1] |
82.8 [69.8, 113.8] |
<0.001 |
|
|
Table 2: Contrast empirical distributions expressed in absolute value percentage units and summarized by the median and the interquartile range (IQR) of the distributions. |
|||||
|
Tissue1/Tissue2 |
Number of Cases |
Field Strength |
IRGRE |
FSGRE |
P-value |
|
Median |
Median |
||||
|
%[IQR] |
%[IQR] |
||||
|
Lesion/Vessel |
23 |
1.5T |
68.5 [60.2, 77.6] |
13.7 [5.8, 32.3] |
<0.001 |
|
15 |
3T |
80.6 [73.8, 82.4] |
9.0 [6.8, 18.4] |
<0.001 |
|
|
|
|
|
|
|
|
|
Lesion/Liver |
23 |
1.5T |
42.7 [40.4, 59.2] |
38.8 [20.2, 52.0] |
0.038 |
|
15 |
3T |
53.3 [40.4, 59.2] |
43.4 [36.3, 50.0] |
0.041 |
|
|
|
|
|
|
|
|
|
Vessel/Liver |
39 |
1.5T |
60.3 [45.3, 99.2] |
40.8 [31.7, 54.1] |
<0.001 |
|
16 |
3T |
139.5 [102.3, 164.4] |
37.2 [30.0, 43.5] |
<0.001 |
|
|
Table 3: Contrast-to-noise ratio (CNR) empirical distributions expressed in absolute value units and summarized by the median and the interquartile range (IQR) of the distributions. |
|||||
|
Tissue1/Tissue2 |
Number of Cases |
Field Strength |
IRGRE |
FSGRE |
P-value |
|
Median |
Median |
||||
|
[IQR] |
[IQR] |
||||
|
Lesion/Vessel |
23 |
1.5T |
64.8 [40.1, 82.0] |
14.6 [5.6, 27.2] |
<0.001 |
|
15 |
3T |
147.8 [127.4, 192.5] |
9.4 [4.8, 17.7] |
<0.001 |
|
|
|
|
|
|
|
|
|
Lesion/Liver |
23 |
1.5T |
20.6 [12.5, 36.9] |
42.9 [22.0, 81.2] |
0.001 |
|
15 |
3T |
51.2 [29.7, 53.7] |
58.2 [45.3, 76.1] |
0.008 |
|
|
|
|
|
|
|
|
|
Vessel/Liver |
39 |
1.5T |
29.2 [22.3, 46.6] |
62.4 [41.2, 88.7] |
<0.001 |
|
16 |
3T |
99.3 [83.0.4, 153.4] |
46.0 [40.7, 62.5] |
<0.001 |
|
Images: Examples of lesion/vessel contrast in HP IRGRE and FSGRE are given in figures 1-3.
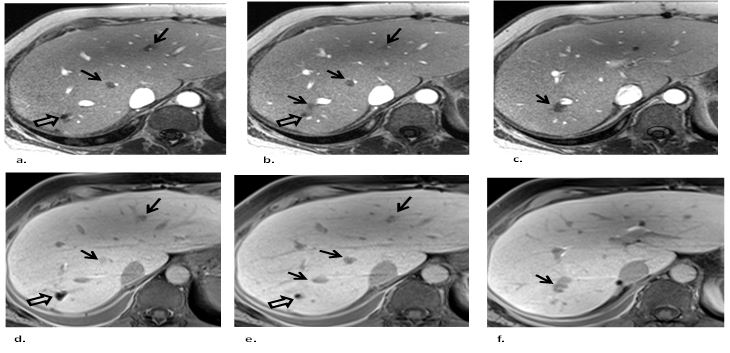
Figure 1: Three consecutive axial hepatobiliary phase gadoxetic-acid contrast-enhanced (a,b,c) IRGRE and corresponding (d,e,f) FSGRE images of the liver obtained at 3T in a patient with metastatic neuroendocrine tumor. There are several small low signal intensity metastases (straight arrows) next to vessels. The lesions are readily depicted on IRGRE and can be well distinguished from the adjacent high signal intensity vessels. However, the lesions are more difficult to detect on the FSGRE images because they display similar low signal intensity as the adjacent vessels. Note that the high signal intensity of the vessels in the IRGRE images is from inflow of unsaturated spins. At hepatobiliary phase the vessels in FSGRE display low signal intensity because the intravascular component of the contrast agent has been mostly cleared by the kidneys. The signal void in a, b, d and e (open arrows) in the posterior aspect of the right lobe is caused by susceptibility artifact from surgical clips related to prior wedge resection of a metastasis.
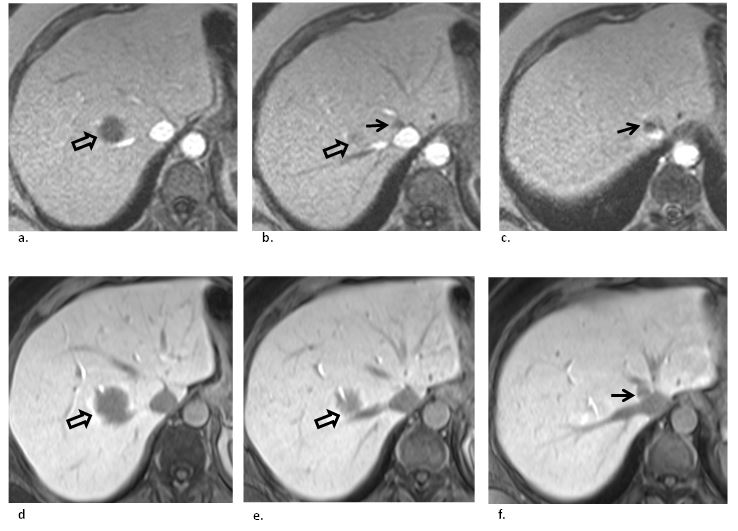
Figure 2: Three consecutive axial hepatobiliary phase gadoxetic-acid contrast-enhanced (a,b,c) IRGRE and corresponding (d,e,f) FSGRE images of the liver obtained at 1.5T in a patient with multiple liver metastases from colon cancer. There is a large metastasis (open arrows) abutting the right hepatic vein posteriorly. The low signal intensity lesion is well depicted against the surrounding normal parenchyma. (b, c) An additional small metastasis (straight arrows) located at the confluence of the right and middle hepatic vein near the inferior vena cava is well depicted on IRGRE because of the high lesion/vessel contrast. However, it is much more difficult to identify on FSGRE (f, straight arrow) because it displays similar low signal intensity as the vessels, and hence can be easily overlooked.
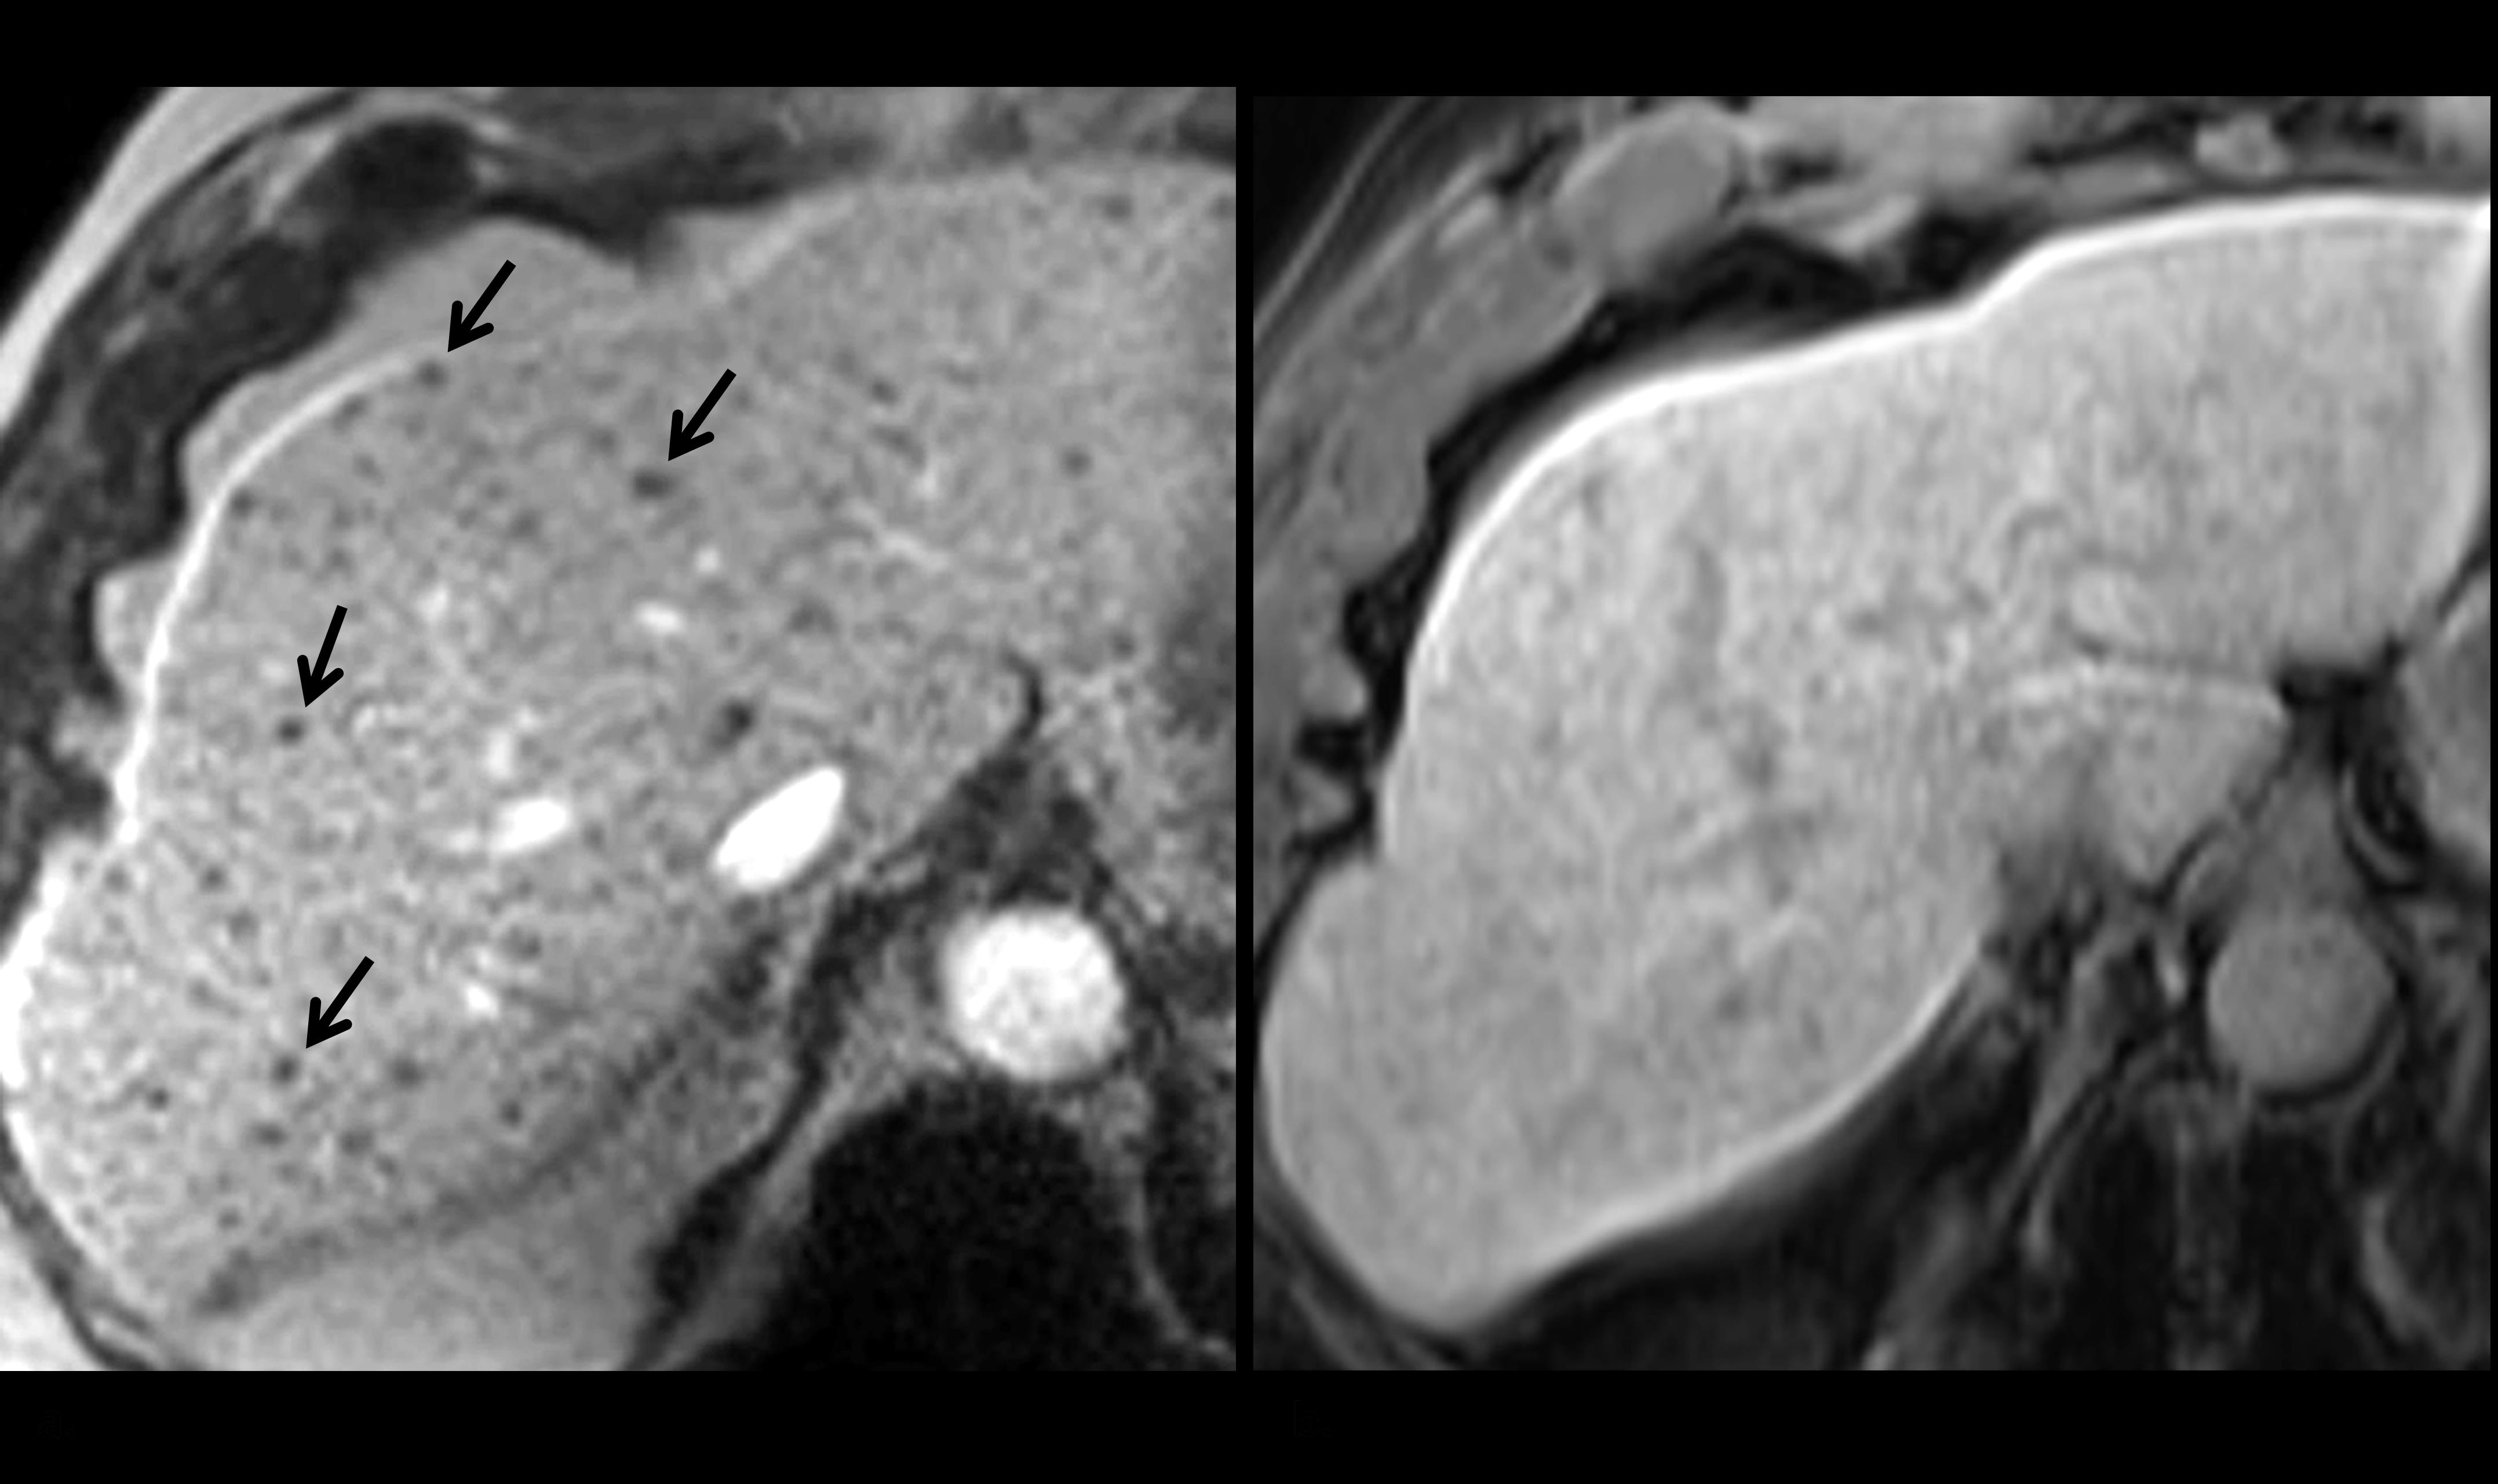
Figure 3: Axial hepatobiliary phase gadoxetic-acid contrast-enhanced (a) IRGRE and corresponding (b) FSGRE images obtained at 1.5T in a patient with metastatic neuroendocrine tumor to the liver who was unable to breath hold completely during the examination. There are numerous small metastases that are readily depicted in (a) as low signal intensity foci (several indicated with arrows), but are imperceptible in (b) as the image is slightly degraded from respiratory motion artifact.
Discussion
It was found that contrast and CNR between metastases and vessels on HP gadoxetic-acid-enhanced images were significantly and substantially greater for IRGRE than FSGRE. Since there is relatively little difference in SI between lesions and vessels on FSGRE images, differentiation of a metastasis from an adjacent intrahepatic vessel on these images is largely based visually on the difference in diameter, and the continuing, longitudinal appearance of the vessel on consecutive slices compared to the localized appearance of the lesion. When a metastasis is small, however, and approaches the diameter of that for a vessel, detection can become more difficult, and the lesion can be overlooked and mistaken for a vessel because of similarity in SI [6,10,11]. In these instances, availability of HP IRGRE images can be helpful with identifying the lesions because of the high contrast between structures. We therefore include HP IRGRE in our routine liver lesion protocol using hepatocyte-specific-enhanced MR imaging as it can facilitate lesion detection, particularly the small ones adjacent to vessels, and potentially improve clinical diagnosis. There are several features of the IRGRE pulse sequence that are distinctly different from FSGRE, the pulse sequence most commonly used with HP liver imaging [1,2,4-11,20,21]. First, whereas in FSGRE the T1 tissue contrast is determined by the TR and flip angle, the dominant parameter in determining tissue contrast in IRGRE is the inversion time (TI), i.e., the time interval between the inversion RF pulse and the acquisition of the central k-space data of the GRE pulse sequence. It has been our experience that when a relatively long TI is used (700 ms at 1.5T, and 900 ms at 3T, respectively) allowing acquisition of the central lines of k-space data of the GRE pulse sequence when the longitudinal magnetization corresponding to hemangiomas passes through the transverse plane causing the lesions to display low SI (using conventional magnitude reconstruction), they can be easily differentiated, without use of intravenous contrast material, from other lesions such as metastases (displaying intermediate-low SI relative to liver) and cysts (displaying intermediate SI with a low intensity surrounding margin [15]. Second, by applying a slice-selective IR pulse, the long TI permits substantial flow of unsaturated spins into the image plane, causing the major hepatic vessels to display high SI and the smaller, more peripheral vessels to have sufficient signal to display an intensity that is greater than or equal to that of the surrounding gadoxetic-acid-enhanced parenchyma. Thus, the overall appearance of liver parenchyma is more homogeneous than that in FSGRE where the vessels are seen as low SI structures traversing the tissue. Because on IRGRE the SI of vessels is higher or, for smaller vessels, similar to that of the surrounding parenchyma, lesions displaying low SI such as metastases are easily distinguished from the normal parenchyma and vessels because of the high contrast between these tissues. Since, with FSGRE, there is relatively little inflow enhancement due to the thickness of the (3D) slab and the short time interval between consecutive RF pulses, the vessels display relatively low SI, similar to that of metastases. As a result, small lesions adjacent to vessels may be difficult to identify, see Figures 1 and 2. Third, since IRGRE is a 2D single-shot technique, it is relatively robust against ghost artifacts from respiration. This is because the acquisition time per slice is much less than the respiratory cycle. Hence, when a patient is unable to breath hold during the acquisition, or moves, images can be obtained that are relatively free of motion artifacts, and lesions can still be visualized, see Figure 3a. This is in contrast to FSGRE which is relatively prone to ghost artifacts when the patient is breathing; typically these artifacts affect all images of the data set leading to lesion obscuration, see Figure 3b. There are several limitations of IRGRE that are inherent to the pulse sequence design and that can affect assessment of liver metastases on HP gadoxetic-acid-enhanced images. First, because of the relatively short time period allowed by the breath-hold duration, the timing limitation imposed by the inversion-recovery structure of the pulse sequence, and the desire to collect multiple slices during a single breath hold, the number of phase-encoding steps for the GRE component of the pulse sequence is limited. Consequently, the in-plane spatial resolution for the IRGRE images is lower than that for the typical FSGRE technique. Second, the liver SNR on IRGRE images is generally lower than that on FSGRE, even with the added signal from the accumulated gadoxetic-acid contrast agent within the hepatocytes. It is for this reason that we use a larger voxel volume for IRGRE compared to FSGRE to compensate for the low SNR. Nevertheless, despite this limitation, lesion/vessel contrast for HP IRGRE was shown to be better for IRGRE than for FSGRE in this study. Although the relatively low spatial resolution and relatively low SNR of the IRGRE images may limit the ability to detect clinically relevant lesions this is, in our experience, not always the case. Third, as is the case with other 2D single-shot acquisition techniques, breathing by the patient during data acquisition can lead to an apparent irregular spacing of the anatomy caused by the (predominantly) cranial-to-caudad movement of the abdominal structures. This can lead to apparent “gaps” between axial slices from the shifting anatomy caused by the fact that the anatomy of interest for the acquisition of some slices differs from that for the acquisition of other slices. Consequently, lesions that fall in these “gaps” are not visualized. Also, when tissues move in and out of the selected slice during image acquisition, changes in tissue contrast can occur as not all tissues within a given slice experience all RF pulses of the pulse sequence. These contrast changes can lead to obscuration of lesions, or cause signal voids that mimic lesions. These “gaps” and variations in tissue contrast do not occur in FSGRE due to the 3D nature of the acquisition. To limit the respiratory artifacts on IRGRE we now acquire these images with respiratory gating, something that was not yet implemented when this study was performed. We did not consider the effect of lesion size on depicting metastases adjacent to vessels using IRGRE as our study was merely designed to determine quantitative differences in signal and contrast between lesions and vessels. Also, the sensitivity and specificity of IRGRE in detecting metastases, and the effect of breathing artifacts, were not assessed. Further investigation is needed to determine the clinical value of HP IRGRE in diagnosing liver metastases in patients with cancer. Because of these limitations, we do not suggest that IRGRE be used instead of FSGRE for lesion detection on HP gadoxetic-acid-enhanced images. Rather, the technique can be helpful when used in conjunction with HP contrast-enhanced-FSGRE as it facilitates lesion detection without the use of additional, gadolinium-based intravascular contrast agent [12]. Once a possible lesion is found on HP IRGRE, correlation with the corresponding FSGRE images will need to be performed to determine whether the lesion is real and represents a metastasis. Obviously, images from other pulse sequences, such as T2-weighted, diffusion-weighted, and arterial, portal venous, and equilibrium phase dynamic, contrast-enhanced images should also be considered when evaluating the liver for metastases with MR imaging [13]. This study was also limited by technical factors associated with making noise measurements in clinical images acquired with commonly-used features such as prescan normalization, optimized multicoil image reconstruction, and parallel imaging. When these features are used, the statistics of noise measured in the image background may not reflect that for noise associated with a region of interest (e.g., normal tissue or a lesion) in the central portion of the field of view. Further, the background noise statistics are not the same as those for conventional single-coil magnitude-reconstructed images [22]. For our study, this issue was likely more important for the FSGRE acquisition, because parallel imaging with an acceleration factor of 2 or 4 was used for FSGRE, whereas no parallel imaging was used for the IRGRE acquisition. For FSGRE, one would expect potentially higher noise levels in certain central regions secondary to parallel-imaging acceleration, which would result in overestimation of corresponding SNR or CNR values when these values are based on noise in the image background. Since this situation would favor FSGRE over IRGRE, it did not change our primary finding that lesion/vessel CNR was greater for IRGRE than for FSGRE, however. Another limitation of this study is that specific pulse sequence optimizations (e.g., flip angle, repetition time or inversion time) were not performed. Instead, established clinical MR protocols, in use for several years at our institution, were employed. In conclusion, it was shown that lesion/vessel contrast and CNR on HP gadoxetic-acid enhanced MR imaging were significantly and substantially greater for IRGRE than for FSGRE, potentially allowing improved visualization of metastases, particularly when small and adjacent to vessels. Despite the limitations of IRGRE with respect to in-plane spatial resolution, slice thickness, and apparent gaps and contrast variations in case of patient breathing, the addition of HP IRGRE in a liver metastasis MR protocol using gadoxetic-acid enhanced FSGRE could potentially facilitate lesion detection, and aid in clinical diagnosis.
Abbreviations
Single Shot Inversion-Recovery Gradient-Echo (IRGRE),
Hepatobiliary phase (HP)
2-dimensional (2D)
Inversion Recovery Gradient-Echo (IRGRE)
Fat-Saturated Gradient-Echo (FSGRE)
Signal intensity (SI)
Signal-to-noise ratio (SNR)
Contrast-to-noise ratio (CNR)
Standard deviation (SD)
Magnetic Resonance (MR)
Inversion-recovery (IR)
Repetition time (TR)
Time delay (TI)
Interquartile range (IQR)
References
1. Morin C, Drolet S, Daigle C, et al. 2019. Additional value of gadoxetic acid-enhanced MRI to conventional extracellular gadolinium-enhanced MRI for the surgical management of colorectal and neuroendocrine liver metastases. Ref.: https://pubmed.ncbi.nlm.nih.gov/31640929/ Doi: https://doi.org/10.1016/j.hpb.2019.09.009
2. Ringe KI, Husarik DB, Sirlin CB, et al. 2010. Gadoxetate Disodium–Enhanced MRI of the Liver: Part 1, Protocol Optimization and Lesion Appearance in the Noncirrhotic Liver. American Journal of Roentgenology. 195: 13-28. Ref.: https://pubmed.ncbi.nlm.nih.gov/20566794/ Doi: https://doi.org/10.2214/ajr.10.4392
3. Hamm B, Staks T, Muhler A, et al. 1995. Phase I clinical evaluation of Gd-EOB-DTPA as a hepatobiliary MR contrast agent: safety, pharmacokinetics, and MR imaging. Radiology. 195: 785-792. Ref.: https://pubmed.ncbi.nlm.nih.gov/7754011/ Doi: https://doi.org/10.1148/radiology.195.3.7754011
4. Vogl TJ, Kummel S, Hammerstingl R, et al. 1996. Liver tumors: comparison of MR imaging with Gd-EOB-DTPA and Gd-DTPA. Radiology. 200: 59-67. Ref.: https://pubmed.ncbi.nlm.nih.gov/8657946/ Doi: https://doi.org/10.1148/radiology.200.1.8657946
5. Bluemke DA, Sahani D, Amendola M, et al. 2005. Efficacy and safety of MR imaging with liver-specific contrast agent: U.S. multicenter phase III study. Radiology. 237: 89-98. Ref.: https://pubmed.ncbi.nlm.nih.gov/16126918/ Doi: https://doi.org/10.1148/radiol.2371031842
6. Goodwin MD, Dobson JE, Sirlin CB, et al. 2011. Diagnostic Challenges and Pitfalls in MR Imaging with Hepatocyte-specific Contrast Agents. RadioGraphics. 31: 1547-1568. Ref.: https://pubmed.ncbi.nlm.nih.gov/21997981/ Doi: https://doi.org/10.1148/rg.316115528
7. Tsurusaki M, Sofue K, Murakami T. 2016. Current evidence for the diagnostic value of gadoxetic acid-enhanced magnetic resonance imaging for liver metastasis. Hepatol Res. 46: 853-861. Ref.: https://pubmed.ncbi.nlm.nih.gov/26750497/ Doi: https://doi.org/10.1111/hepr.12646
8. Chung WS, Kim MJ, Chung YE, et al. 2011. Comparison of gadoxetic acid-enhanced dynamic imaging and diffusion-weighted imaging for the preoperative evaluation of colorectal liver metastases. J Magn Reson Imaging. 34: 345-353. Ref.: https://pubmed.ncbi.nlm.nih.gov/21702068/ Doi: https://doi.org/10.1002/jmri.22671
9. Tirumani SH, Jagannathan JP, Braschi-Amirfarzan M, et al. 2018. Value of hepatocellular phase imaging after intravenous gadoxetate disodium for assessing hepatic metastases from gastroenteropancreatic neuroendocrine tumors: comparison with other MRI pulse sequences and with extracellular agent. Abdom Radiol. Ref.: https://pubmed.ncbi.nlm.nih.gov/29470627/ Doi: https://doi.org/10.1007/s00261-018-1496-1
10. Shimada K, Isoda H, Hirokawa Y, et al. 2010. Comparison of gadolinium-EOB-DTPA-enhanced and diffusion-weighted liver MRI for detection of small hepatic metastases. Eur Radiol. 20: 2690-2698. Ref.: https://pubmed.ncbi.nlm.nih.gov/20563726/ Doi: https://doi.org/10.1007/s00330-010-1842-3
11. Motosugi U, Ichikawa T, Morisaka H, et al. 2011. Detection of pancreatic carcinoma and liver metastases with gadoxetic acid-enhanced MR imaging: comparison with contrast-enhanced multi-detector row CT. Radiology. 260: 446-453. Ref.: https://pubmed.ncbi.nlm.nih.gov/21693662/ Doi: https://doi.org/10.1148/radiol.11103548
12. Bannas P, Bookwalter CA, Ziemlewicz T, et al. 2017. Combined gadoxetic acid and gadofosveset enhanced liver MRI for detection and characterization of liver metastases. Eur Radiol. 27: 32-40. Ref.: https://pubmed.ncbi.nlm.nih.gov/27137648/ Doi: https://doi.org/10.1007/s00330-016-4375-6
13. Van Beers BE, Pastor CM, Hussain HK. 2012. Primovist, Eovist: what to expect? J Hepatol. 57: 421-429. Ref.: https://pubmed.ncbi.nlm.nih.gov/22504332/ Doi: https://doi.org/10.1016/j.jhep.2012.01.031
14. de Lange EE, Mugler JP, Bertolina JA, et al. 1991. Magnetization prepared rapid gradient-echo (MP-GRE) MR imaging of the liver: Comparison with spin-echo imaging. Magnetic Resonance Imaging. 9: 469-476. Ref.: https://pubmed.ncbi.nlm.nih.gov/1779716/ Doi: https://doi.org/10.1016/0730-725x(91)90031-g
15. de Lange EE, Mugler JP, Bosworth JE, et al. 1994. MR Imaging of the Liver: Breath-hold Tl-weighted MP-GRE Compared with Conventional T2-weighted SE Imaging-Lesion Detection, Localization, and Characterization. Radiology. 190:727-736. Ref.: https://pubmed.ncbi.nlm.nih.gov/8115619/ Doi: https://doi.org/10.1148/radiology.190.3.8115619
16. de Lange EE, Mugler JP, Gay SB, et al. 1996. Focal Liver Disease: Comparison of Breath-hold Tl-weighted MP-GRE MR Imaging and Contrast-enhanced CT-Lesion Detection, Localization, and Characterization. Radiology. 200: 465-473. Ref.: https://pubmed.ncbi.nlm.nih.gov/8685343/ Doi: https://doi.org/10.1148/radiology.200.2.8685343
17. de Lange EE, Mugler, JP, Bertolina JA, et al. 1992. Selective versus Nonselective Preparation Pulses in Two-dimensional MP-RAGE Imaging of the Liver. 2: 355-358. Ref.: https://pubmed.ncbi.nlm.nih.gov/1627872/ Doi: https://doi.org/10.1002/jmri.1880020317
18. Cohen-Hallaleh V, Guo L, Hosseini-Nik H, et al. 2017. Does injection flow rate have an impact on arterial phase image degradation in liver MRI? A comparison of gadoxetic acid versus gadobutrol. Clin Radiol. 72: 1-994. Ref.: https://pubmed.ncbi.nlm.nih.gov/28673445/ Doi: https://doi.org/10.1016/j.crad.2017.06.005
19. Rofsky NM, Lee VS, Laub G, et al. 1999. Abdominal MR Imaging with a Volumetric Interpolated Breath-hold Examination. Radiology. 212: 876-884. Ref.: https://pubmed.ncbi.nlm.nih.gov/10478260/ Doi: https://doi.org/10.1148/radiology.212.3.r99se34876
20. Okada M, Murakami T, Kuwatsuru R, et al. 2016. Biochemical and Clinical Predictive Approach and Time Point Analysis of Hepatobiliary Phase Liver Enhancement on Gd-EOB-DTPA-enhanced MR Images: A Multicenter Study. Radiology. 281: 474-483. Ref.: https://pubmed.ncbi.nlm.nih.gov/27195437/ Doi: https://doi.org/10.1148/radiol.2016151061
21. Granata V, Catalano O, Fusco R, et al. 2015. The target sign in colorectal liver metastases: an atypical Gd-EOB-DTPA "uptake" on the hepatobiliary phase of MR imaging. Abdom Imaging. 40: 2364-2371. Ref.: https://pubmed.ncbi.nlm.nih.gov/26105523/ Doi: https://doi.org/10.1007/s00261-015-0488-7
22. Henkelman RM. 1985. Measurement of signal intensities in the presence of noise in MR images. Med Phys. 12: 232-233. Ref.: https://pubmed.ncbi.nlm.nih.gov/4000083/ Doi: https://doi.org/10.1118/1.595711