
-
Mail us:
editor@raftpubs.org
Indexing & Abstracting
Full Text
Research ArticleDOI Number : 10.36811/ijpmh.2019.110004Article Views : 55Article Downloads : 43
Justification of Calculation of Illegal Drug Consumption
Andrey Soloviev1*, Yuri Bogdasarov2 and Elena Ichitovkina3
1Doctor of Medical Sciences, Professor, Head, Department of Psychiatry and Clinical Psychology, Northern State Medical University, Arkhangelsk, Russia
2MD, Chief Specialist - Psychiatrist, Department of Psychological Diagnostics, Center for Psychophysiological Diagnostics, Central Medical Unit, Ministry of Internal Affairs of Russia, Moscow, Russia
3Doctor of Medical Sciences, Professor, Department of Psychological, Pedagogical and Medical Support of Internal Affairs Bodies Activities, All-Russian Institute for Advanced Studies, Ministry of Internal Affairs of Russia, Moscow, Russia
*Corresponding Author: Andrey Soloviev, Doctor of Medical Sciences, Professor, Head, Department of Psychiatry and Clinical Psychology, Northern State Medical University, Arkhangelsk, Russia, Email: ASoloviev1@yandex.ru
Article Information
Aritcle Type: Research Article
Citation: Andrey Soloviev, Yuri Bogdasarov, Elena Ichitovkina. 2019. Justification of Calculation of Illegal Drug Consumption. Int J Psychiatr Ment Health. 1: 27-32.
Copyright: This is an open-access article distributed under the terms of the Creative Commons Attribution License, which permits unrestricted use, distribution, and reproduction in any medium, provided the original author and source are credited. Copyright © 2019; Andrey Soloviev
Publication history:
Received date: 28 August, 2019Accepted date: 06 September, 2019
Published date: 10 September, 2019
Abstract
The drug situation monitoring system in Russia uses data on the number of drugs withdrawn from circulation in a weight indicator. However, this does not reflect the real extent of the danger, since differences in the activity of substances and population density of different administrative districts are not taken into account. Based on the analysis of statistical data, a methodology for calculating the prevalence of drugs based on the determination of conventional doses that are multiples of the size of the narcotic drugs, determining the onset of criminal liability and determining their prevalence in the territory of the administrative district per 100,000 population is proposed.
Keywords: Narcotic drugs; Methodology for calculating seized psychoactive substances; Drug situation; Drug monitoring
Determining the extent of the illicit distribution and consumption of narcotic drugs is one of the goals of monitoring the drug situation [5]. Among the sources of information about the extent of their proliferation appear and information about illegal traffic seizure of psychoactive substances (PAS) at the moment of criminal case [3]. The annual reports of the Russian State Anti-Narcotics Committee provide data on the weight of seized surfactants, while the degree of danger of individual drugs is not reflected [2]. As a result of this approach, an opinion is formed that the most common are the drugs of the cannabis group, which do not represent a significant social danger. In addition, differences in population in administrative districts are not taken into account. Thus, the modernization of methodological approaches to assessing the illegal distribution and consumption of surfactants is required, as, for example, this has already been proposed when taking into account the extent of alcohol-attributive mortality [6].
The purpose of the study is to justify the use of the methodology for calculating the amount of surfactants seized to determine the extent of their illegal distribution and consumption.
Materials and Research Methods
Analyzed special forms of interagency statistical reporting for 2015-2018 in the Russian Federation (RF). The data were converted into conventional doses in accordance with the established sizes of surfactants that determine the onset of criminal liability. Prevalence rates were calculated per 100,000 administrative district populations. St atistical processing of the research results was carried out using the SPSS 22.0 program. The search for linear relationships between the two features was carried out using the Pearson correlation coefficient.
The results of the study: For the period 2015-2018, Russian law enforcement authorities withdrawn from circulation more than 100 000 kg of PAS (Table. 1).
|
Table 1: The number of PAS seized by major groups for 2015-2018 in weight indicator (in kg). |
|||||
|
Years |
Opiates |
Cannabinoids |
Amphetamines |
Cocaine |
“Spice” |
|
2015 |
3 170.3 |
23 438.5 |
3 383.7 |
954.5 |
1 490.2 |
|
2016 |
1 411.0 |
15 084.1 |
2 400.4 |
143.7 |
710.4 |
|
2017 |
977.3 |
14 346.8 |
4 490.9 |
442.9 |
518.1 |
|
2018 |
1 161.5 |
15 202.9 |
3 457.1 |
47.6 |
365.7 |
For the recalculation, we used the parameters of the PAS size, which are minimal for the formation of the offense and the onset of criminal liability (Table 2) [4].
|
Table 2: Minimal dimensions of narcotic drugs and plants for the formation of the offense and the onset of criminal liability (kg) |
|||
|
PAS |
The size (in kg) |
PAS |
The size (in kg) |
|
Opium group |
|||
|
Poppy straw |
0.02 |
Opium |
0.001 |
|
Acetylated Opium |
0,0005 |
Morphine |
0.0001 |
|
Heroin |
0,0005 |
Desomorphine |
0.00005 |
|
Sleeping pills |
0.02 |
|
|
|
Cannabis group |
|||
|
Cannabis |
0.006 |
Hashish |
0.002 |
|
Cannabis oil |
0,0004 |
Hemp |
0.006 |
|
Amphetamine group |
|||
|
MDMA |
0,0006 |
Methamphetamine |
0,0003 |
|
Ephedron |
0,0002 |
Mephedrone |
0,0002 |
|
N-Methylephedrone |
0,0002 |
|
|
|
Other narcotic drugs |
|||
|
Cocaine |
0,0005 |
Synthetic cannabinoids |
0.00005 |
The calculation was carried out according to the formula:
Conditional dose (c.d.) = weight / size (Table 3).
|
Table 3: The number of PAS seized by major groups for 2015-2018 (c.d.) |
|||||
|
Years |
Opiates |
Cannabinoids |
Amphetamines |
Cocaine |
“Spice” |
|
2015 |
4 091 084 |
5 780 906 |
15 976 117 |
1 909 082 |
29 804 160 |
|
2016 |
1 978 608 |
3 801 500 |
10 843 087 |
287 490 |
14 208 660 |
|
2017 |
1 077 322 |
3 574 850 |
19 267 123 |
885 844 |
10 362 460 |
|
2018 |
1 478 612 |
3 913 087 |
15 595 920 |
95 106 |
7 313 120 |
To assess the prevalence of PAS in administrative districts, seizure rates in arbitrary doses were recalculated to the level and prevalence according to the formula [1] (Table 4):
Prevalence = c.d. * 100,000 / population of the administrative district
|
Table 4: Levels of prevalence for major PAS groups for 2015-2018 by administrative district (in urban units per 100,000 population). |
|||||
|
Years |
Opiates |
Cannabinoids |
Amphetamines |
Cocaine |
Spice |
|
Russian Federation |
|||||
|
2015 |
2 797 |
3 952 |
10 923 |
1 305 |
20 377 |
|
2016 |
1 350 |
2 594 |
7 399 |
196 |
9 696 |
|
2017 |
734 |
2 435 |
13 124 |
603 |
7 059 |
|
2018 |
1 007 |
2 666 |
10 624 |
65 |
4 982 |
|
Central District |
|||||
|
2015 |
6 821 |
2 088 |
5 742 |
160 |
23 531 |
|
2016 |
2 086 |
1 175 |
5 697 |
79 |
18 223 |
|
2017 |
1 357 |
1 010 |
15 519 |
1 926 |
4 389 |
|
2018 |
2 301 |
1 131 |
14 310 |
38 |
1 178 |
|
Northwest District |
|||||
|
2015 |
372 |
3 157 |
3 897 |
11 014 |
12 409 |
|
2016 |
372 |
2 262 |
1 656 |
23 |
6 430 |
|
2017 |
717 |
950 |
31 196 |
112 |
3 994 |
|
2018 |
93 |
2 500 |
2 100 |
185 |
5 812 |
|
North Caucasus District |
|||||
|
2015 |
422 |
2 720 |
1 179 |
0 |
4 187 |
|
2016 |
505 |
1 862 |
2 183 |
1 |
906 |
|
2017 |
351 |
1 075 |
1 170 |
2 |
572 |
|
2018 |
359 |
1 096 |
1 768 |
1 |
307 |
|
Southern District |
|||||
|
2015 |
732 |
3 330 |
4 346 |
38 |
4 852 |
|
2016 |
188 |
1 529 |
4 490 |
3 |
1 250 |
|
2017 |
368 |
1 654 |
4 409 |
453 |
2 503 |
|
2018 |
256 |
1 046 |
4 474 |
7 |
1 259 |
|
Volga region |
|||||
|
2015 |
871 |
1 361 |
19 820 |
7 |
18 863 |
|
2016 |
1 550 |
605 |
5 689 |
3 |
5 818 |
|
2017 |
435 |
651 |
5 369 |
11 |
9 107 |
|
2018 |
498 |
1 242 |
10 614 |
15 |
5 076 |
|
Ural District |
|||||
|
2015 |
1 608 |
1 760 |
12 041 |
51 |
46 203 |
|
2016 |
2 056 |
1 402 |
12 023 |
3 |
12 486 |
|
2017 |
674 |
1 038 |
18 381 |
10 |
14 709 |
|
2018 |
999 |
1 180 |
17 634 |
41 |
22 632 |
|
Siberian District |
|||||
|
2015 |
3 301 |
7 069 |
13 659 |
3 |
25 729 |
|
2016 |
1 226 |
6 031 |
9 627 |
4 |
10 742 |
|
2017 |
476 |
3 758 |
14 484 |
18 |
11 411 |
|
2018 |
770 |
3 355 |
11 364 |
5 |
6 835 |
|
Far Eastern District |
|||||
|
2015 |
745 |
27 232 |
31 402 |
0 |
15 430 |
|
2016 |
316 |
14 742 |
22 239 |
- |
4 253 |
|
2017 |
314 |
23 244 |
12 943 |
2 |
8 452 |
|
2018 |
579 |
23 683 |
12 600 |
- |
2 070 |
Regional differences are noted, for example, a significant increase in the prevalence of amphetamines and a sharp decrease in synthetic cannabinoids in the Central Administrative District of RF, as well as high levels of spice prevalence, while opiates are insignificant, in the Far Eastern District. It should be noted that in both administrative districts, cocaine prevalence levels in recent years are close to zero.
Pearson's correlation coefficients for the structure of the prevalence of surfactants by administrative districts reveal the presence of significant differences in the indicators of the Far Eastern, North Caucasian and North-Western districts compared with the figures for RF as a whole, which, apparently, is determined by both regional characteristics of preferred consumption and the characteristics of the work of special services (Table 5).
|
Table 5: Pearson correlation coefficients for the prevalence of PAS in RF in 2015-2018. |
||||||||
|
Years |
Central District |
Northwest District |
North Caucasus District |
Southern District |
Volga region |
Ural District |
Siberian District |
Far Eastern District |
|
2015 |
0,91 |
0,49 |
0,49 |
0,83 |
0,89 |
0,97 |
0,99 |
0,39 |
|
2016 |
0,89 |
0,84 |
0,48 |
0,61 |
0,96 |
0,97 |
0,95 |
0,22 |
|
2017 |
0,94 |
0,92 |
0,67 |
0,98 |
0,73 |
0,96 |
0,97 |
0,34 |
|
2018 |
0,90 |
0,43 |
0,82 |
0,98 |
0,99 |
0,77 |
0,99 |
0,15 |
Changing the structure of the withdrawn PAS when switching from measurement of absolute weight on prevalence rates in conventional doses per 100 000 population, for RF and the Central District are shown in (Figures 1-2).
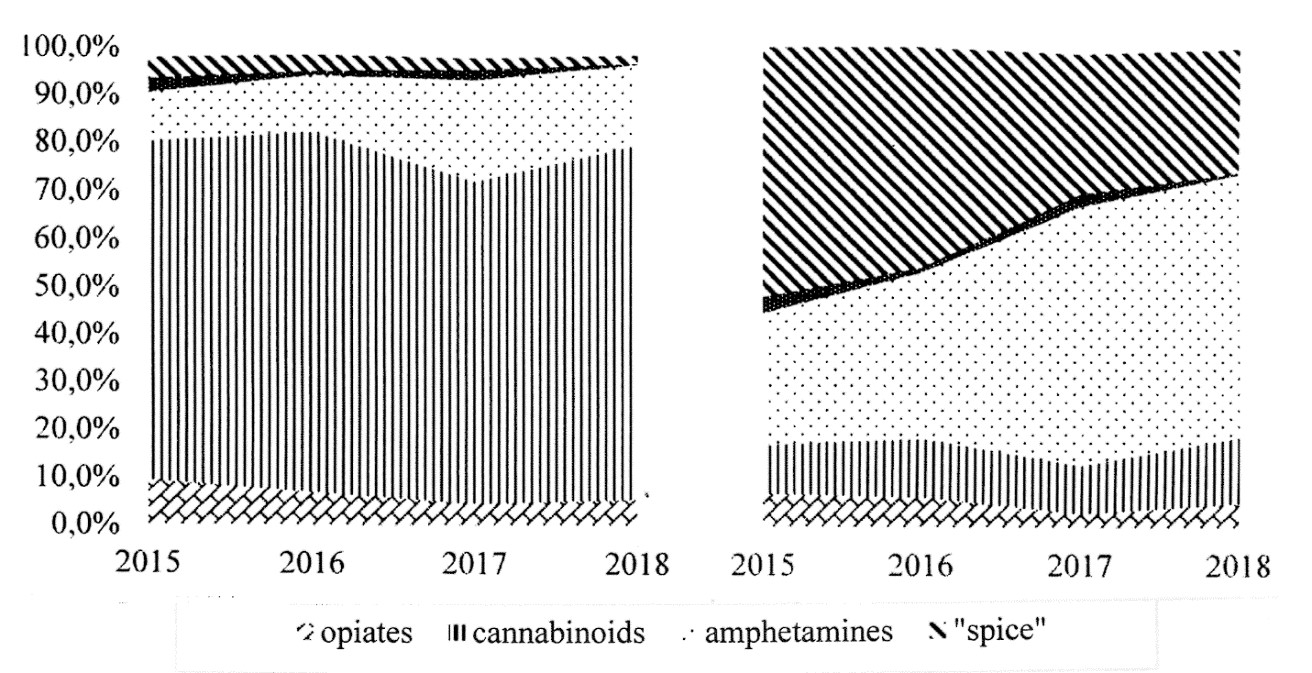
Figure 1: The structure of seized PAS in RF in 2015-2018 (on the left - in the weight indicator, on the right - prevalence levels in c.d.)
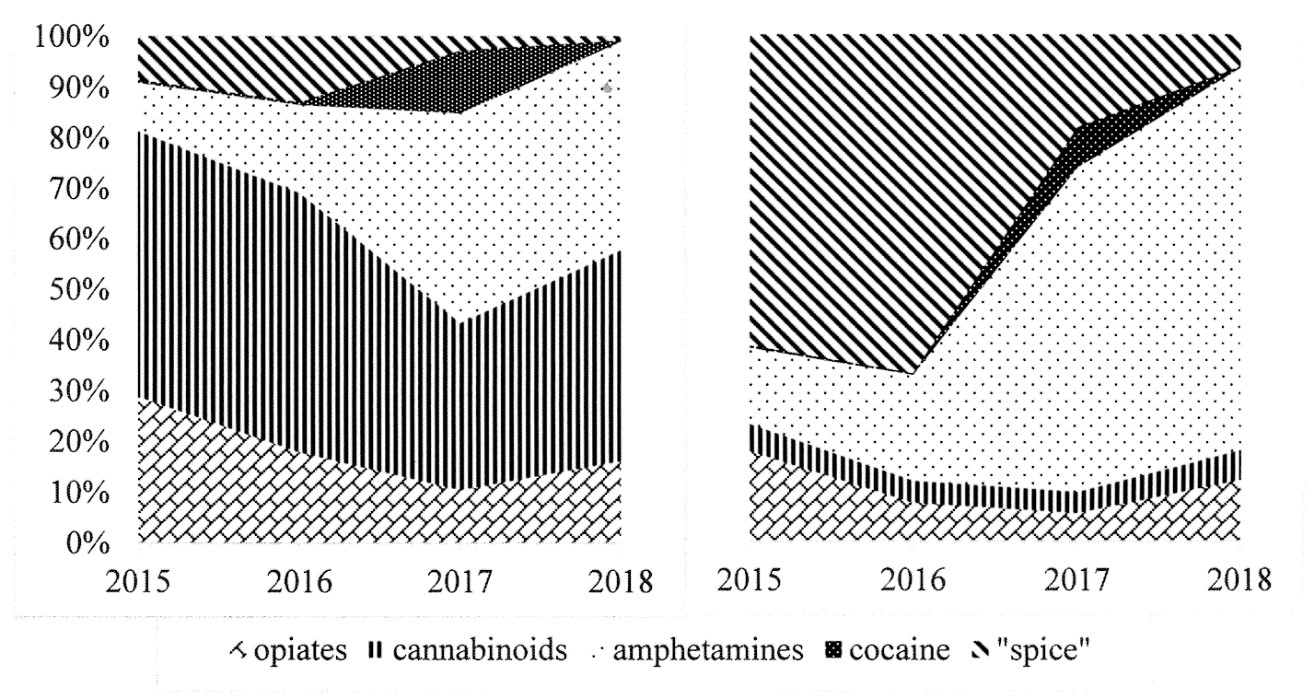
Figure 2: The structure of seized PAS in the Central District in 2015-2018 (on the left - in the weight indicator, on the right - prevalence levels in c.d.)
It becomes clear that amphetamines (including synthetic cathinones) do not predominate in the structure of seizures in RF, and their specific gravity tends to increase. Synthetic cannabinoids (“spice”) also have a significantly larger specific gravity in the seizure structure than the weight analysis shows. However, their prevalence tends to decrease. The rates for opiates and cocaine are virtually unchanged. In the Central District, the overwhelming prevalence of amphetamines is noted, and the prevalence of cannabinoids is significantly lower than in RF. Spice consumption has declined rapidly in recent years.
Discussion of the Results
The results of the study show that the data on the weight indicator of PAS withdrawn from illegal trafficking does not reflect the degree of danger of individual drugs. Our proposed methodology for assessing the prevalence of surfactants from information on their seizure provides a more reliable picture of the spectrum and extent of consumption of controlled substances. This approach can be used in the overall integrated assessment when monitoring the drug situation at the federal and regional levels.
References
1. Demographic Yearbook of Russia. Stat. Sat / Rosstat. - M. 2017.
2. Methodology and procedure for monitoring, as well as criteria for assessing the development of drug situations in the Russian Federation and its constituent entities (third revision) [Electronic resource]: approved. Minutes of the meeting of the SAC of February 15, 2017 No. 32. The document was not published. Access from sprav.-legal system "Consultant Plus".
3. On the approval of significant, large and especially large sizes of narcotic drugs and psychotropic substances, as well as significant, large and especially large sizes for plants containing narcotic drugs or psychotropic substances, or their parts containing narcotic drugs or psychotropic substances, for the purposes of Articles 228, 228.1, 229 and 229.1 of the RF Criminal Code: approved. Government Decree RF of October 1, 2012. No. 1002 // Collected. RF Legislation. - 2012. - No. 41, Article 5624.
4. Regulation on the state system for monitoring drug situations in RF: approved. Government Decree RF of June 20, 2011. No. 485 // Collected. RF Legislation. - 2011. - No. 26, Article 3808. 5. Report on the drug situation in RFn in 2017 (excerpt) [Electronic resource] // State Anti-Drug Committee. Ref.: https://bit.ly/2lBD4vsn
6. Soloviev AG, Vyazmin AM, Mordovsky EA. 2012. Methodological approaches to accounting for alcohol-attributive mortality in Russia and abroad // Reviews on clinical pharmacology and drug therapy. 10: 30-41.