
-
Mail us:
editor@raftpubs.org
Indexing & Abstracting
Full Text
Research ArticleDOI Number : 10.36811/ojfnr.2019.110002Article Views : 288Article Downloads : 175
Validation of data provided by the deuterium oxide dose-to-mother technique for better evaluation of breastfeeding practice
Nadine Danielle Coulibaly1*, Serge M.A. Somda2,4, Césaire Tania Ouédraogo1,3, Augustin N. Zéba1, Hermann Sorgho1, Jean-Bosco Ouédraogo1
1Institut de Recherches en Sciences de la Santé, Direction Régionale de l’Ouest, Bobo-Dioulasso, 01 BP 545 Bobo 01, Burkina Faso
2Centre Muraz, Bobo-Dioulasso, Burkina Faso
3Program in International and Community Nutrition, Department of Nutrition, University of California, Davis, USA
4Université Nazi Boni, UFR/Sciences et Techniques, Bobo-Dioulasso, Burkina Faso
*Corresponding author: Nadine Danielle Coulibaly, Institut de Recherches en Sciences de la Santé, Direction Régionale de l’Ouest, Bobo-Dioulasso, 01 BP 545 Bobo 01, Burkina Faso, Email: coulibalynadine@gmail.com
Article Information
Aritcle Type: Research Article
Citation: Nadine Danielle Coulibaly, Serge MA Somda, Césaire Tania Ouédraogo, et al. 2019. Validation of data provided by the deuterium oxide dose-to-mother technique for better evaluation of breastfeeding practice. Open J Food Nutri Res. 1: 08-16.
Copyright: This is an open-access article distributed under the terms of the Creative Commons Attribution License, which permits unrestricted use, distribution, and reproduction in any medium, provided the original author and source are credited. Copyright © 2019; Nadine Danielle Coulibaly
Publication history:
Received date: 15 April, 2019Accepted date: 16 May, 2019
Published date: 18 May, 2019
Abstract
We describe a simple method to validate data collected from a study using the deuterium oxide dose-to-the-mother technique for breastfeeding evaluation. We used human milk intake calculation spreadsheets (n=180). The calculation was performed by fitting the deuterium enrichment data to a model for water turnover in the mother and in the baby. We assumed that the validity of the results is as high as the square root mean square error (SRMSE) between calculated and fitted data is low. Based on the original spreadsheets that fitted well with the model (n=87), we developed a simple prediction of the SRMSE and we used it as cut-off to check, correct (by removing enrichment data) and validate or remove the other spreadsheets. We found a cut-off dependent on the measured enrichment (E_m) that was . And the mean SRMSE (90%CI) of the fitted sheets was 23.37 mg.kg-1 (22.01 mg.kg-1, 24.73 mg.kg-1) with a maximum of 38.96 mg.kg-1. After correction we noticed that the number of enrichments removed per file varied from 1 to 4. We observed within the corrected spreadsheets a significant reduction (p≤0.0001, n=53) of the SRMSE (90%CI) from 49.78 mg.kg-1 (46.35 mg.kg-1, 53.20mg.kg-1) before correction to 25.88 mg.kg-1 (24.13 mg.kg-1, 27.64 mg.kg-1) after correction. We also observed that after correction, the mean difference (90%CI) of HM respectively non-HM that was 29.34 mg.kg-1 (21.71 mg.kg-1, 36.97 mg.kg-1) respectively 24.13 mg.kg-1 (17.4 mg.kg-1, 30.79 mg.kg-1) was strongly (p≤0.0001, n=53) different from zero. Therefore, the correction is very important to optimizing the results.
Keywords: Breastfeeding; Deuterium; Excel spreadsheet; Square root mean square error; Validation
Introduction
The deuterium oxide dose-to-mother technique [1] is presented as a promise tool for exclusive breastfeeding (EBF) evaluation. The dose is orally administrated to the mother and saliva samples are collected over a period of 14 days. Deuterium enrichment in saliva is analyzed by Isotope Ratio Mass Spectrometry (IRMS) or Fourier Transform Infrared Spectrometry (FTIR). The IRMS is more sensitive than the FTIR, but the FTIR is improved to be a simple, rapid method for measuring deuterium enrichment in physiological fluid [2,3] and it is appropriated for limited resource setting as it permit to overcome the practical problem link to the IRMS equipment, which is more expensive and need specialist for analysis [2,4]. The calculation of human milk (HM) intake and intake of water from sources other than milk (non-HM) is performed by fitting the deuterium enrichment data to a model for water turnover in the mother and in the baby [2]. The quality of the output (HM and non-HM) will be as high as the mean square error between observed and fitted enrichment is low. Ideally, the square root means square error (SRMSE) that characterizes the best fitting should be zero but this is impossible in practice. Moreover, there is no range of values set for the SRMSE. That represents a big challenge in the data validation as it is difficult to know if the outputs of the calculation (HM and non-HM) are really of high quality and should be used for the final results. Therefore, it becomes necessary to have a cut-off that can be used for the validation of the data. In the present work we describe a simple method to validate the data provided by studies using the deuterium dilution technique for breastfeeding evaluation. We developed a prediction method of the SRMSE that could help to check and correct or removed inappropriate data if necessary. The main objective was to provide to the user of the technique a guideline that could help them to well assess their results and decide on their validity.
Methods
The Human Milk calculation spreadsheets
The body composition and the HM intake estimation using deuterium dilution is performed by fitting the deuterium enrichment data to a model for water turnover in the mother and in the baby and it lies on complex formulas [5-9]. Standard Excel spreadsheets are been developed by Cowards and coworkers [1,10] to facilitate this estimation. A template is given in the supplementary material (excel file). The users are invited to enter the mother and the baby’s age, their anthropometrical measures and different deuterium enrichment values of sample collected at different time points on both mother and child. The spreadsheet uses prepared equations in order to estimate the model parameters using the Excel’s solver add-on. This parameter is then used to compute body composition and milk intake information. This is a very good way to simplify advanced techniques for simple using such as using z-score Tables. We worked on 180 spreadsheets. Each spreadsheet represented a mother-baby dyad data collected during a breastfeeding evaluation study that we conducted in Burkina Faso using a deuterium dilution technique. Briefly, after anthropometric measurement and saliva sample collection from the mother and her baby, an accurate dose of 30g of deuterium oxide (DO) was given to the mother. The mother fed the baby as usual and the baby received the deuterium from his mother through breast milk. Post doses saliva samples were collected from the mother and her baby at day 1, 2, 3, 4, 13 and 14 post dosing. Deuterium enrichment in the saliva was analyzed by FTIR (Shimadzu 8400S) according to the method described in the IAEA manual [2]. The data were entered in the human milk calculation spreadsheet and the solver function was used to perform the calculation by minimizing the SRMSE.
Classification of the spreadsheet
The best fitting with the model requires complete data for each mother-baby dyad including weight, the 12 post doses enrichment and the time of saliva samples collection. And all the measured enrichment must be on the kinetic curve. In the absence of an objective reference method to assess data quality, the goodness of fitted curves provided by the models were observed. We assumed that the modeling curve which is very close with the actual data should come from valid data. Finally, that method was used as first approach to determine reference spreadsheets. We checked all the spreadsheets for data completeness and we separated them in 2 groups: complete spreadsheets and incomplete spreadsheets. In each group of spreadsheets, we identified those without unfitting data. That meant that all the enrichment seemed to be on the deuterium kinetic curve. All spreadsheets with unfitted data (one or several enrichments are out of the curve) have been subjected to the correction. With the complete fitted spreadsheets, we calculated the cut-off and used it to check the others data.
Determination of the SRMSE cut-off
Our approach is based on the hypothesis that even if there is an error between the measured and calculated enrichment, this error should be proportional to the measured enrichment for both mother and baby data during the 14 days. This suppose that the measurement error would be smaller with low measures and larger with high values.
So, the best fitting with the model would signify that there is a unique number α such as:
With Ec = enrichment calculated and Em = enrichment measured
By definition, the mean square error (MSE) between the measured and the calculated enrichment at each day is:
For each mother-baby dyad during the 14 days the sum of MSE would be:
Then the square root mean square error should be
After determining α value for each fitting spreadsheet we excluded from the group the spreadsheets with α value higher than mean +2SD as outlier. We recalculated the mean + 2SD as αmax.
We assumed that the experimental SRMSE should be less than before the spreadsheet could be validated.
Correction of the unfitted data
The correction consisted in removing enrichment line that didn’t fit with the model We assumed that if there were incomplete spreadsheets with remaining data that fitted well with the model it is also possible to remove the unfitted data in order to have the best fitting and generate results with small error. Therefore, the corrected file will seem to be incomplete spreadsheet with data fitting well with the model. The enrichment that presented a big MSE were removed if the SRMSE was greater than . For the mother, as deuterium kinetic in mother is exponential in the model, the maternal body composition is determined by back extrapolation method using the logarithm that is linear, so three well-fitting enrichment data are sufficient to make the maternal curve. For the baby, as the enrichment increases from day 1 and reach the maximum at day 4 and decrease to day 14, we assume that it is important to avoid removing 2 adjacent data in order to maintain this kinetic and the day 14 can’t be removed as it is crucial to HM intake calculation in the model. So, with these criteria, no more than 50% of the enrichment data should be removed. After removing the enrichment line, the SRMSE was refined and then it was compared with the cut- off. All the spreadsheets that couldn’t be corrected these criteria were rejected. All the data were recorded in excel spreadsheet and analyzed with STATA software. The proportions of the different type of spreadsheets were calculated. We analyzed the effect of the correction of enrichment on the SRMSE as well as on the HM and the non-HM by means comparison before and after correction. Mean comparison was made using the t-test (paired t-test and one sample mean comparison test).
Results
Final value of SRMSE cut-off and the validated spreadsheets
As shown in Table 1, the mean SRMSE (95%CI) of the complete spreadsheets was 23.37 mg.kg-1 (22.01 mg.kg-1, 24.73 mg.kg-1) and the mean α (95%CI) was 0.017 (0.015, 0.018) with αmax= 0.027. So:
| Table 1: SRMSE and α value of the fitted sheets (n=87). | |||
|---|---|---|---|
| Mean | 95 %CI | Max | |
| SRMSE (mg.kg-1) | 23.37 | 22.01 24.73 |
38.96 |
| α value | 0.017 | 0.015 0.018 |
0.027 |
SRMSEmax (mg.kg-1) =
The correction of the complete sheets (n=53) showed that the number of enrichments removed varied from 1 per sheet to a maximum of 4 per sheet and only 2 sheets (3.8%) reached this maximum as indicated in Table 2.
| Table 2: Proportion of sheets corrected according to the number of enrichments removed (n=53). | ||||
|---|---|---|---|---|
| Different level of correction | Classification | |||
| Number of enrichments removed | 1 | 2 | 3 | 4 |
| Proportion of the corrected sheets | 32.1 (n=17) |
35.8 (n=19) |
28.3 (n=15) |
3.8 (n=2) |
The validated spreadsheets represented 96.7% (n=174) and 33.3% of them (n=58) were validated after correction. The files that couldn’t be corrected (n=6) were simply removed. The Figure 1 describes the scheme of validation of the spreadsheets.
Effect of correction on the experimental SRMSE, HM and non-HM calculation
We founded the mean SRMSE (95%CI) decreased significantly (p≤0.0001, n= 53) from 49.78 mg.kg-1 (46.35 mg.kg-1, 53.20 mg.kg-1) to 25.88 mg.kg-1 (24.13 mg.kg-1, 27.64mg.kg-1) after correction. We did not find any significant difference in the mean of HM as well as the non-HM after the enrichment correction. But when we considered the absolute difference at each mother-baby dyad level (decrease or increase in positive value), we observed that the mean difference of HM respectively non-HM that was 29.34 mg.kg-1 (21.71 mg.kg-1, 36.97 mg.kg-1) respectively 24.13 mg.kg-1 (17.4 mg.kg-1, 30.79 mg.kg-1) was strongly (p≤0.0001, n=53) different from zero. The Table 3 shows the results before and after correction.
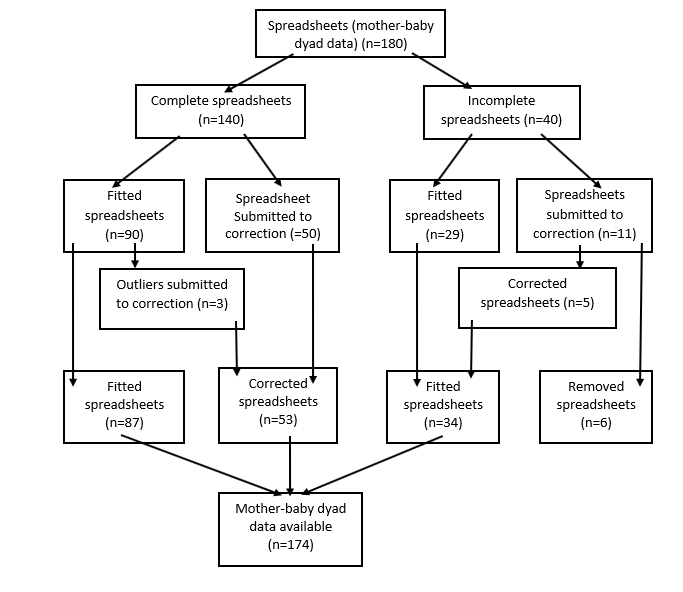
Figure 1: Data validation scheme.
| Table 3: SRMSE, HM and non-HM before and after correction (n=53). | |||||
|---|---|---|---|---|---|
| Before | After | P | Absolute difference | P | |
| SRMSE (mg.kg-1) | 49.781 (46.35, 53.20) |
25.88 (24.13, 27.64) |
0.0000a | _ | _ |
| HM (mg.kg-1) | 725.0 (656.75, 793.24) |
727.4 (659.30, 795.64) |
0.8047 | 29.34 (21.71, 36.97) |
0.0000b |
| Non-HM (mg.kg-1) | 79.15 (42.73, 115.57) |
76.79 (40.68, 112.90) |
0.7663 | 24.13 (17.47, 30.79) |
0.0000 |
| 1mean (95%CI) all such value asignificant difference p<0.0001 bsignificant difference from zero, p<0.0001 |
|||||
Discussion
To monitor and improve infant and children nutrition, evidences need to be raised. In fact, in the monitoring of breastfeeding evaluation for better intervention calculating the quantity of HM intake in different setting and at different age of the babies is not sufficient. It is also important to estimate the non-HM intake in order to have good classifications in term of EBF or non-EBF. The deuterium dilution method is suitable to evaluate breastfeeding practice and this technique is now used in many field studies [2,11-17]. However, complete and accurate complex information is necessary to compute good estimates of HM and non-HM intake. Several samples are to be collected at different time points after deuterium intake. The more we will have time point data, the more accurate the model will be. However, the collected data is subject to metrological errors. Finally, it is better removing a piece of information which looks inconsistent than running probably wrong estimations. The square root MSE is still used as principal tool to identify uncommon data. This lies as an indicator of the validity of the model and it is even recommended to clearly mention it in publications.
This is of high of importance in breastfeeding evaluation as for better intervention not only we need to know with more precision the quantity of HM intake in different setting and at different age of the babies but we also need more precision on the non-HM for better classification in term of EBF or non-EBF. It is not practically possible to eliminate all metrological error as several complex steps of the data production contribute including field data production (anthropometry, saliva sample collection, dose administration) and laboratory analysis (standard preparation, cell filling). In our approach, we figured out a strategy which will make us get a maximum boundary of that error estimated by the SRMSE. The principal limitation of this work is the determination of our reference data. In fact, we checked all the different spreadsheet we had and selected the most accurate ones, according to the fitting as reference. This is quite a subjective approach. However, the main objective is to discuss about how qualitative decision can be taken using the SRMSE. We proposed a comprehensive approach to determine a higher bound for this measure in order to check the quality of the data. One could apply the method using a set of his own data as we did or previous datasets, which are validated and even published can be used.
In the present work, we found out that when the data fitted with the model, the SRMSE is less than . This cut off will help to check if data fit to the model and to eliminate the unfitted enrichment data. We did not provide a unique value as cut-off but a variable dependent of the measured enrichment since the quality of the data is not only linked to the smallest of the SRMSE but also to the contribution of the error produced by each measured enrichment. In fact, the SRMSE could be calculated with some fitting enrichment with very low MSE combined to an unfitted enrichment with a high MSE that increases the SRMSE. That was the case of the 3 outliers in α value calculation. The SRMSE of one of them (32.89) was less than the SRMSEmax but it provided α value of 0.029 that was greater than the αmax due to only one enrichment with a greater MSE. In order to have a better result, the unfitting enrichment needs to be removed even if the SRMSE seems to be low. So, our method helps to track and eliminate the hidden unfitted data. After correction by removing the enrichment line, the significant reduction of SRMSE showed that the correction is really important for the optimization of the results as it provides a best fitting. The example given in the supplementary file illustrates well the validation by correction procedure. Before correction the SRMSE that was 74 mg.kg-1, was higher than the cut-off (47 mg.kg-1). After correction by removing enrichment line, the SRMS was reduced to 24.9 mg.kg-1 and was less than the new SRMS cut-off (42.2 mg.kg-1). We did not directly find any significant difference between the mean before and the mean after correction of HM as well as the non-HM because of some individuals’ values that may decrease when the others increase and their difference’s mean became statistically null. The consideration of the absolute value of difference between data before and after correction of HM and non-HM at each dyad level showed the effectiveness of the correction on HM as well as non-HM). This is critical for establishing the status of breastfeeding in term of exclusive or non-exclusive. For instance, it is known that there is an apparent nom-HM (25 ± 62 g.day-1) among women declared to exclusive breastfeed [18] or else if the non-HM is less than 52 g.day-1, women are declared to exclusive breastfeed [10]. Thus, the validation of the data is essential before applying any of these classifications as it helps to have a good estimation of the non-HM and avoid misreporting on exclusive breastfeeding practice. In this work, we showed that, during breastfeeding evaluation study all the data calculated with the model for breast milk evaluation are not valid and should not be taken in account in the result. The simplest way to validate data from breastfeeding practice evaluation using deuterium dilution technique is to calculate for each mother-baby dyad the value of . and to compare it with the experimental SRMSE. If the SRMSE (mg.kg-1) is above , so it is necessary to correct it. The best way to correct the data is to reanalyze the samples in the laboratory if it is possible to do so and to enter the new enrichments. The second possibility is to remove at maximum 6 enrichments line (3 for the mother, 3 for the baby) according to the criteria that we described above and our result showed that it is possible to have good results by removing less than 6 enrichments as the maximum was 4 (2 for mother and 2 for the baby) and that concerned only 2 sheets. Then the SRMSE is refined using the solver function. After that, if the SRMSE remained high, so the spreadsheet should be excluded from the result.
With this method we validated 96.7% of our final data within 48.3% (n=87) that were originally good. When we corrected the sheets, we made only minor modification by removing 1 or 2 enrichments in 67.9% (n=36) of the file and 3 enrichments in 28.3% (n=15). Only 3.8% reach the level of 4 enrichments removed. That is very minor comparing to the 6 enrichment that could be removed in each sheet. So, our results showed the excellence of the first data provided from the field activities (anthropometry, dose administration, saliva sampling) and from FTIR analysis. We already mentioned that FTIR analysis has been done with the Shimadzu 8400S. With the latest generations of FTIR that are more sensitive and precise, if the field data collection is well conducted and the samples analysis well performed, the result should be better than those given by the Shimadzu 8400S. Then the results should be easily validated according to our methods. The procedure is also applicable to the results generated by the IRMS but using only the spreadsheets specially conceived for IRMS data that are given in molar ratio not in weight ratio like FTIR data.
Conclusion
In this work, we showed that, during breastfeeding evaluation study, all the data calculated with the model for breast milk evaluation are not valid and should not be taken in account in the final result. Here, we described a simple method to validate data collected from a study using the deuterium oxide dose-to-the-mother technique for breastfeeding evaluation. Our work showed that it is possible to have a predictive SRMSE that could serve as cut off for data validation. Based on data from FTIR analysis, we found out that when the data fit well with the model, the SRMSE (mg.kg-1) is always less than . and we used this cut-off to correct the others data. The same procedure is applicable to the IRMS data using spreadsheet conceived for IRMS. Since IRMS is more sensitive and precise compared to FTIR, the result from IRMS should be excellent if samples are well collected and well analyzed. The validation of the data is essential as it helps to have a good estimation of the HM as well the non-HM. Therefore, we strongly recommend to use this validation method in order to optimize the results and avoid misreporting in exclusive breastfeeding practice. We also suggest to clearly mention the SRMSE in the deuterium oxide dose-to-mother studies’ results.
Acknowledgment
We thank the IAEA for the technical support through BKF6004 project.
References
- Coward WA, Cole TJ, Sawyer MB, et al. 1982. Breast-milk intake measurment in mixed fed infants by administration of deuterium oxide to their mothers. Hum Nutr-Clin Nutr. 36: 141-148. [Ref.]
- IAEA . 2010. Stable Isotopes Technique to Assess Intake of Human Milk in Breastfed Infant. IAEA Human Health Series n°7. Vienna: International Atomic Energy Agency. [Ref.]
- Jennings G, Bluck L, Wright A, et al. 1999. The use of infrared spectrophotometry for measuring body water spaces. Clin Chem. 45: 1077-1081. [Ref.]
- IAEA. 2010. Introduction to Body Composition Assessment Using the Deuterium DilutionTechnique with Analysisof Saliva Samples by Fourier Transform Infrared Spectrometry. IAEA Human Health Series n°12. Vienna, Austria: International Atomic energy Agency. [Ref.]
- Shipley RA, Clark RE. 1972. Tracer Methods for in Vivo kinetics. Theory and Applications. In Academic Press. New York and London. [Ref.]
- Holland B, Welch AA, Widdowson's MA. 1991. The composition of foods, 5th edn. Cambridge: The Royal Society of Chemestry.[Ref.]
- Wells JC, Davies PS. 1995. Correction for environmental water influx in measurment of milk volume intake by deuterium turnover in infants. Early Human Develop. 41: 177-182. [Ref.]
- Jensen RG. Handbook of milk composition. Acad Press, New-York: 920[Ref.]
- Siri WE. 1961: Body composition from fluid space and density: Analysis of methods. Washington. DC: National Academy of Sciences.[Ref.]
- Haisma H, Coward WA, Albernaz E, et al. 2003. Breast milk and energy intake in exclusively, predominantly and partially breast-fed infants. Eur J Clin Nutr 57: 1633-1642. [Ref.]
- Butte NF, Wong WW, Patterson BW, et al. 1988. Human-milk intake measure by administration of deuterium oxide to the mother: acomparison with the test-weighting technique. Am J Clin Nutr 47: 815-821. [Ref.]
- Cissé AS, Bluck L, Diallo B, et al. 2002. Stable isotope aided evaluation of Community Nutrition Program: effect of food supplementation schemes on maternal and infant nutritional status. Food Nutr Bull. 23: 169-173. [Ref.]
- DaCosta THM, Haisma H, Wells JCK, et al. 2010. How Much Human Milk Do Infants Consume? Data from 12 Countries Using a Standardized Stable Isotope Methodology. The Journal of Nutrition. [Ref.]
- Bandara T, Hettiarachchi M, Liyanage C, et al. 2015. The Deuterium Oxide–to-the-Mother Method Documents Adequate Breast-Milk Intake among Sri Lankan Infants. Journal of Nutrition 145: 1325-1329. [Ref.]
- Medoua GN, Nana ECS, Ndzana ACA, et al. 2011. Breastfeeding practices of Cameroonian mothers determined by dietary recall since birth and the dose-to-the-mother deuterium-oxide turnover techniquemcn. Maternal and Child Nutrition. [Ref.]
- Choua G, Kari KE, Haloui NE, et al. 2013. Quantitative Assessment of Breastfeeding Practices and Maternal Body Composition in Moroccan Lactating Women during Six Months after Birth Using Stable Isotopic Dilution Technique. International Journal of Maternal and Child Health 1: 45-50. [Ref.]
- Motswagole BS, Matenge STP, Mongwaketse T, et al. 2015. Application of the deuterium-oxide dose-to-mother technique to determine the exclusivity of breastfeedingin women in Kanye, Botswana. S Afr J Clin Nutr. 28: 128-133. [Ref.]
- Moore SE, Prentice AM, Coward WA. 2007. Use of stable techniques to validate infant feeding practice reported by Bangladeshi women receiving breastfeeding counselling. Am J Clin Nutr. 85: 1075-1082. [Ref.]